
Compare Shyam Metalics with Similar Stocks
Dashboard
Company has a Debt to Equity ratio (avg) of 0.02 times
- ROCE(HY) Highest at 13.21%
- PBT LESS OI(Q) At Rs 427.08 cr has Grown at 59.0% (vs previous 4Q average)
- DEBTORS TURNOVER RATIO(HY) Highest at 20.50 times
With ROE of 9.3, it has a Very Expensive valuation with a 2.4 Price to Book Value
Increasing Participation by Institutional Investors
Consistent Returns over the last 3 years
Stock DNA
Iron & Steel Products
INR 28,471 Cr (Small Cap)
26.00
26
0.41%
0.04
9.29%
2.37
Total Returns (Price + Dividend) 
Latest dividend: 2.2 per share ex-dividend date: Aug-19-2025
Risk Adjusted Returns v/s
Returns Beta

News
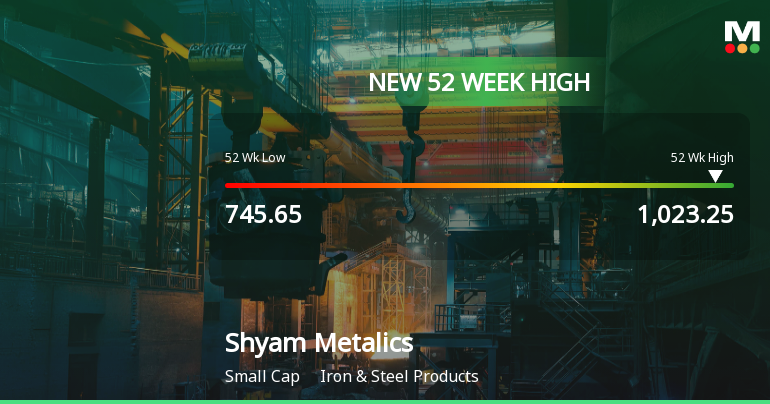
Broad-Based Technical Strength Lifts Shyam Metalics & Energy Ltd to 52-Week High of Rs 1023.25
Surging past its previous peaks, Shyam Metalics & Energy Ltd touched a new 52-week high of Rs 1023.25 on 13 Jul 2026, marking a significant milestone in its price momentum. This advance comes amid a three-day winning streak that has propelled the stock up by nearly 10%, outpacing its sector and broader market indices.
Read full news article
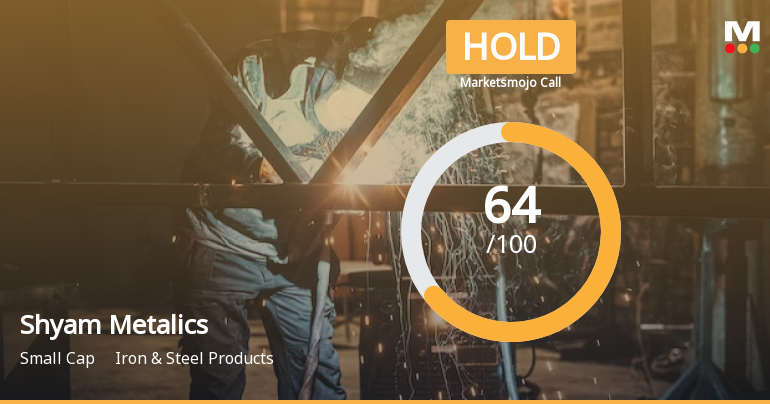
Shyam Metalics & Energy Ltd is Rated Hold by MarketsMOJO
Shyam Metalics & Energy Ltd is rated 'Hold' by MarketsMOJO, with this rating last updated on 06 July 2026. However, the analysis and financial metrics presented here reflect the company’s current position as of 11 July 2026, providing investors with the most up-to-date insight into the stock’s fundamentals, valuation, financial trends, and technical outlook.
Read full news article Announcements
Announcement under Regulation 30 (LODR)-Monthly Business Updates
06-Jul-2026 | Source : BSESales Release - June 2026
Announcement under Regulation 30 (LODR)-Analyst / Investor Meet - Outcome
06-Jul-2026 | Source : BSEWe are enclosing outcome of investor meet
Board Meeting Intimation for Consider And Approved The Unaudited Standalone And Consolidated Financial Results Of The Company For The Quarter Ended June 30 2026. To Consider And Recommend 1St Interim Dividend If Any For The Financial Year 2026-27. Raisi
03-Jul-2026 | Source : BSEShyam Metalics And Energy Ltdhas informed BSE that the meeting of the Board of Directors of the Company is scheduled on 20/07/2026 inter alia to consider and approve the unaudited standalone and consolidated financial results of the Company for the quarter ended 30.06.2026 to consider and recommend 1st interim dividend and raising of funds
Corporate Actions

20 Jul 2026

Shyam Metalics & Energy Ltd has declared 22% dividend, ex-date: 19 Aug 25

No Splits history available

No Bonus history available

No Rights history available
Quality key factors
Valuation key factors
Technicals key factors
 Technical Indicator Scale: Bearish, Mildly Bearish, Sideways, Mildly Bullish, Bullish Turned
 Shareholding Snapshot : Jun 2026
Shareholding Compare (%holding)
Promoters
None
Held by 21 Schemes (1.75%)
Held by 75 FIIs (2.97%)
Subham Buildwell Pvt. Ltd. (21.86%)
Authum Investment And Infrastructure Limited (4.55%)
5.56%
Quarterly Results Snapshot (Consolidated) - Mar'26 - QoQ

QoQ Growth in quarter ended Mar 2026 is 18.52% vs -1.03% in Dec 2025
QoQ Growth in quarter ended Mar 2026 is 61.78% vs -24.65% in Dec 2025
Half Yearly Results Snapshot (Consolidated) - Sep'25
Growth in half year ended Sep 2025 is 22.50% vs 15.49% in Sep 2024
Growth in half year ended Sep 2025 is 12.67% vs -28.56% in Sep 2024
Nine Monthly Results Snapshot (Consolidated) - Dec'25
YoY Growth in nine months ended Dec 2025 is 20.86% vs 14.73% in Dec 2024
YoY Growth in nine months ended Dec 2025 is 8.96% vs -15.47% in Dec 2024
Annual Results Snapshot (Consolidated) - Mar'26
YoY Growth in year ended Mar 2026 is 22.39% vs 14.88% in Mar 2025
YoY Growth in year ended Mar 2026 is 17.85% vs -12.24% in Mar 2025
About Shyam Metalics & Energy Ltd

Company Coordinates


