
Compare Signet Industrie with Similar Stocks
Dashboard
High Debt company with Weak Long Term Fundamental Strength
- Poor long term growth as Net Sales has grown by an annual rate of 10.25% and Operating profit at 10.27% over the last 5 years
- Company's ability to service its debt is weak with a poor EBIT to Interest (avg) ratio of 1.34
- The company has been able to generate a Return on Equity (avg) of 6.41% signifying low profitability per unit of shareholders funds
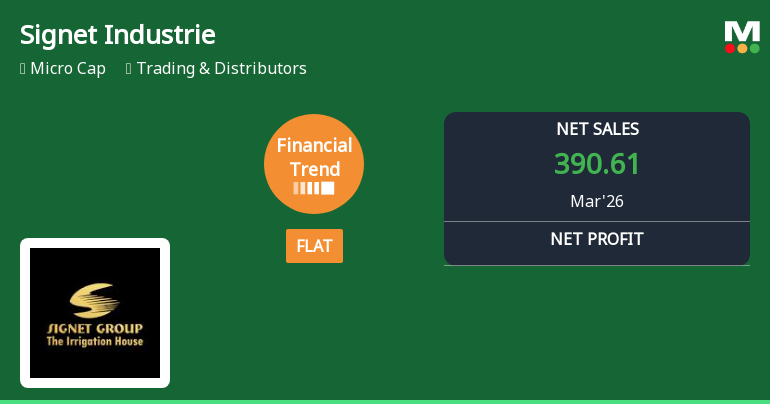
Flat results in Mar 26
Underperformed the market in the last 1 year
Stock DNA
Trading & Distributors
INR 144 Cr (Micro Cap)
7.00
35
1.04%
1.79
7.81%
0.57
Total Returns (Price + Dividend) 
Latest dividend: 0.5 per share ex-dividend date: Sep-23-2025
Risk Adjusted Returns v/s
Returns Beta

News
Signet Industries Ltd Reports Flat Quarterly Performance Amid Margin Pressures
Signet Industries Ltd, a micro-cap player in the Trading & Distributors sector, has reported a flat financial performance for the quarter ended March 2026, signalling a notable shift from its previously positive growth trajectory. Despite record net sales and robust profit before tax growth, the company faces challenges in return on capital and debt management, prompting a downgrade in its Mojo Grade to Strong Sell.
Read full news articleAre Signet Industries Ltd latest results good or bad?
The latest financial results for Signet Industries Ltd reveal a mixed operational performance for the quarter ended March 2026. The company reported a net sales figure of ₹390.61 crores, reflecting a marginal quarter-on-quarter growth of 0.12%. This growth is significantly lower compared to the previous quarter's robust increase of 27.29%. However, on a year-on-year basis, the sales growth stood at a healthier 7.07%, indicating some resilience in maintaining revenue levels compared to the same period last year. In terms of profitability, the net profit for the quarter decreased to ₹6.85 crores from ₹7.41 crores in the prior quarter, marking a sequential decline of 7.57%. This decline raises concerns about the sustainability of earnings, especially in light of the company's challenges with high interest costs and margin compression. The operating margin, which stood at 6.97%, also showed a notable decrease ...
Read full news article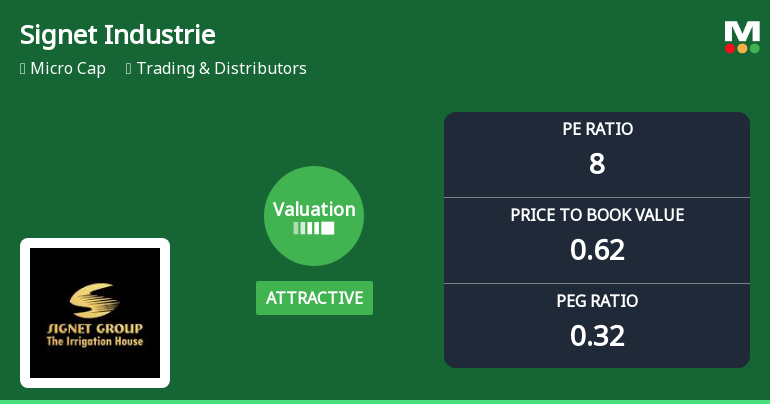
Signet Industries Ltd Valuation Shifts Signal Renewed Price Attractiveness
Signet Industries Ltd, a micro-cap player in the Trading & Distributors sector, has witnessed a notable shift in its valuation parameters, moving from a very attractive to an attractive rating. This change reflects evolving market perceptions amid a challenging price performance and competitive peer landscape, prompting investors to reassess the stock’s price appeal relative to its historical and sector benchmarks.
Read full news article Announcements
Announcement under Regulation 30 (LODR)-Newspaper Publication
02-Jun-2026 | Source : BSENewspaper publication of the Financial results
Corporate Action-Board approves Dividend
30-May-2026 | Source : BSEOutcome of Board meeting approves dividend subject to approval of shareholders in the ensuing AGM
Announcement under Regulation 30 (LODR)-Change in Management
30-May-2026 | Source : BSEAppointment of Cost Auditor and Internal auditor for the financial year 2026-27
Corporate Actions

No Upcoming Board Meetings

Signet Industries Ltd has declared 5% dividend, ex-date: 23 Sep 25

Signet Industries Ltd has announced 10:10 stock split, ex-date: 13 Aug 18

Signet Industries Ltd has announced 5:1 bonus issue, ex-date: 18 Nov 10

No Rights history available
Quality key factors
Valuation key factors
Technicals key factors
 Technical Indicator Scale: Bearish, Mildly Bearish, Sideways, Mildly Bullish, Bullish Turned
 Shareholding Snapshot : Mar 2026
Shareholding Compare (%holding)
Promoters
None
Held by 0 Schemes
Held by 0 FIIs
Shree Balaji Starch And Chemicals Limited (13.2%)
Pranay Trades Links LLP (2.83%)
21.07%
Quarterly Results Snapshot (Standalone) - Mar'26 - QoQ

QoQ Growth in quarter ended Mar 2026 is 0.12% vs 27.29% in Dec 2025
QoQ Growth in quarter ended Mar 2026 is 32.75% vs 48.70% in Dec 2025
Half Yearly Results Snapshot (Standalone) - Sep'25

Growth in half year ended Sep 2025 is 10.92% vs -8.48% in Sep 2024
Growth in half year ended Sep 2025 is 11.86% vs -43.87% in Sep 2024
Nine Monthly Results Snapshot (Standalone) - Dec'25
YoY Growth in nine months ended Dec 2025 is 17.43% vs -6.29% in Dec 2024
YoY Growth in nine months ended Dec 2025 is 13.12% vs -31.47% in Dec 2024
Annual Results Snapshot (Standalone) - Mar'26
YoY Growth in year ended Mar 2026 is 14.22% vs -2.80% in Mar 2025
YoY Growth in year ended Mar 2026 is 3.32% vs 1.23% in Mar 2025
About Signet Industries Ltd

Company Coordinates


