
Compare Simbhaoli Sugar with Similar Stocks
Dashboard
With a Negative Book Value, the company has a Weak Long Term Fundamental Strength
- Poor long term growth as Net Sales has grown by an annual rate of -4.69% and Operating profit at 0% over the last 5 years
- The company has a negative book value of Rs 155.58 crore
Flat results in Jun 25
Risky - Negative Book Value
Total Returns (Price + Dividend) 

Risk Adjusted Returns v/s
Returns Beta
News
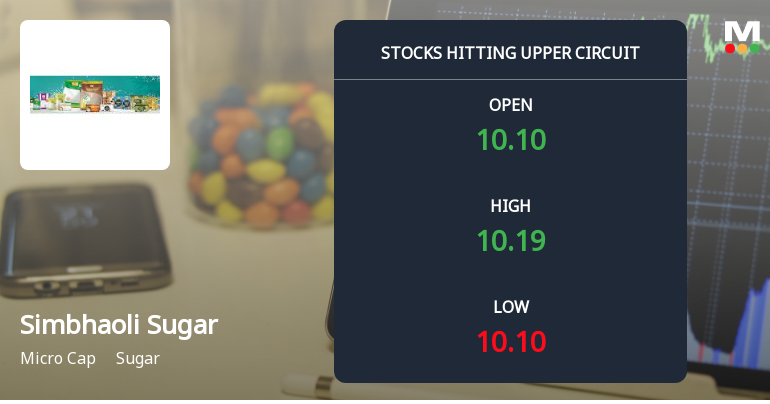
Simbhaoli Sugars Ltd Locks at Upper Circuit With 4.84% Gain — Buyers Queue, Sellers Absent
At Rs 10.19, the buying was done — not because demand dried up, but because the exchange wouldn't let the stock go any higher. Simbhaoli Sugars Ltd locked at its upper circuit of 4.84% on 23 Apr 2026, with buyers queuing and no sellers willing to part with shares.
Read full news article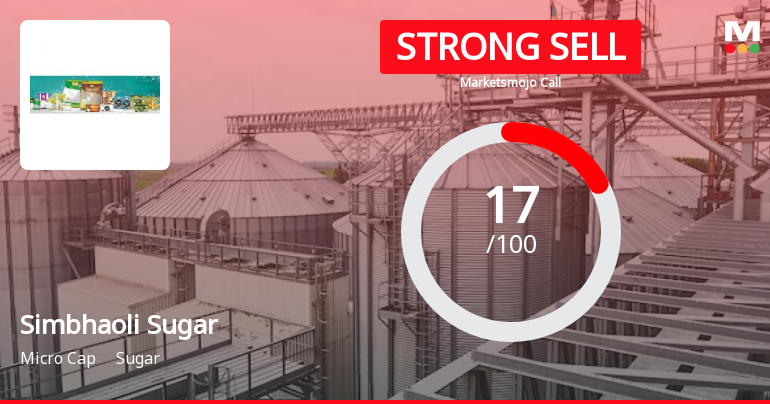
Simbhaoli Sugars Ltd is Rated Strong Sell
Simbhaoli Sugars Ltd is rated Strong Sell by MarketsMOJO. This rating was last updated on 12 August 2024, reflecting a significant reassessment of the stock’s outlook. However, the analysis and financial metrics presented here are based on the company’s current position as of 23 April 2026, providing investors with the latest insights into its performance and prospects.
Read full news article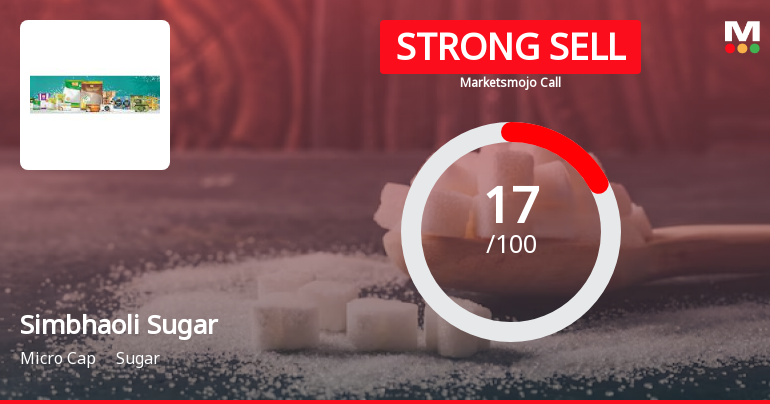
Simbhaoli Sugars Ltd is Rated Strong Sell
Simbhaoli Sugars Ltd is rated Strong Sell by MarketsMOJO. This rating was last updated on 12 August 2024. However, the analysis and financial metrics discussed here reflect the company’s current position as of 10 April 2026, providing investors with the latest insights into the stock’s fundamentals, valuation, financial trends, and technical outlook.
Read full news article Announcements
Updates
11-Sep-2019 | Source : NSE
| Simbhaoli Sugars Limited has informed the Exchange regarding 'Disclosure pursuant to Regulation 24A of the Securities and Exchange Board of India (Listing Obligations and Disclosure Requirements) Regulations, 2015 ("Listing Regulations")'. |
Updates
03-Sep-2019 | Source : NSE
| Simbhaoli Sugars Limited has informed the Exchange regarding 'Newspaper advertisement published in Newspaper for convening 8th Annual General Meeting of the Members of the Company'. |
Shareholders meeting
31-Aug-2019 | Source : NSE
| Simbhaoli Sugars Limited has informed the Exchange regarding Notice of Annual General Meeting to be held on September 25, 2019 |
Corporate Actions

No Upcoming Board Meetings

No Dividend history available

No Splits history available

No Bonus history available

No Rights history available
Quality key factors
Valuation key factors
Technicals key factors
 Technical Indicator Scale: Bearish, Mildly Bearish, Sideways, Mildly Bullish, Bullish Turned
 Shareholding Snapshot : Mar 2026
Shareholding Compare (%holding)
Promoters
11.9573
Held by 1 Schemes (0.0%)
Held by 1 FIIs (0.0%)
Dholadhar Investments Pvt Ltd (18.08%)
None
41.51%
Quarterly Results Snapshot (Standalone) - Dec'25 - YoY

YoY Growth in quarter ended Dec 2025 is -8.10% vs -27.05% in Dec 2024
YoY Growth in quarter ended Dec 2025 is -70.30% vs -209.92% in Dec 2024
Half Yearly Results Snapshot (Standalone) - Sep'25
Growth in half year ended Sep 2025 is -4.07% vs -16.20% in Sep 2024

Growth in half year ended Sep 2025 is -54.74% vs 57.95% in Sep 2024
Nine Monthly Results Snapshot (Standalone) - Dec'25
YoY Growth in nine months ended Dec 2025 is -5.42% vs -20.17% in Dec 2024
YoY Growth in nine months ended Dec 2025 is -56.50% vs 50.16% in Dec 2024
Annual Results Snapshot (Standalone) - Mar'25
YoY Growth in year ended Mar 2025 is -16.76% vs -3.18% in Mar 2024
YoY Growth in year ended Mar 2025 is 298.76% vs 61.54% in Mar 2024
About Simbhaoli Sugars Ltd

Company Coordinates


