
Compare Simran Farms with Similar Stocks
Dashboard
Weak Long Term Fundamental Strength with a -21.56% CAGR growth in Operating Profits over the last 5 years
- Low ability to service debt as the company has a high Debt to EBITDA ratio of 2.96 times
- The company has been able to generate a Return on Capital Employed (avg) of 9.88% signifying low profitability per unit of total capital (equity and debt)
Below par performance in long term as well as near term
Total Returns (Price + Dividend) 
Latest dividend: 0.8000 per share ex-dividend date: Sep-20-2012
Risk Adjusted Returns v/s
Returns Beta

News
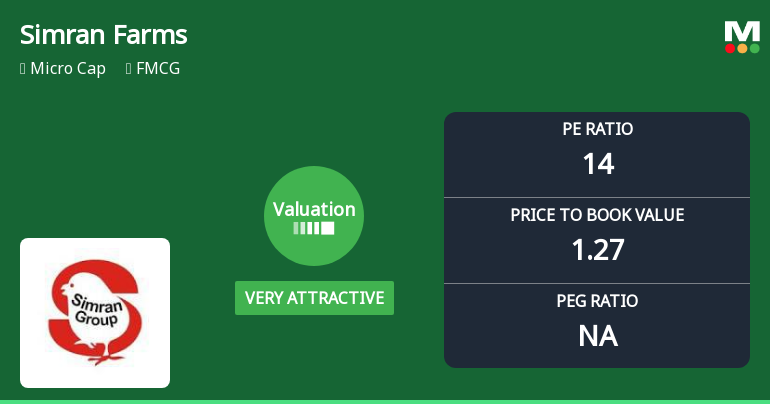
Simran Farms Ltd Valuation Shifts Signal Renewed Price Attractiveness Amid Market Challenges
Simran Farms Ltd, a micro-cap player in the FMCG sector, has seen a notable shift in its valuation parameters, moving from an attractive to a very attractive rating. Despite recent share price declines and a challenging market environment, the company’s price-to-earnings (P/E) and price-to-book value (P/BV) ratios suggest a compelling entry point relative to its historical averages and peer group.
Read full news articleAre Simran Farms Ltd latest results good or bad?
Simran Farms Ltd's financial results for Q4 FY26 present a complex picture, characterized by both sequential recovery and significant year-on-year challenges. The company reported a net profit of ₹2.82 crores, marking a substantial sequential increase of 149.56% compared to the previous quarter. However, this figure reflects a stark decline of 187.85% when compared to the same quarter last year, indicating persistent profitability issues. Revenue for the quarter reached ₹248.70 crores, which represents a 6.91% increase from ₹232.62 crores in Q3 FY26. This growth in revenue is notable as it is the highest quarterly revenue recorded in the trailing twelve-month period, suggesting some improvement in demand or pricing in the poultry segment. Operating margins also showed positive movement, expanding to 2.18%, the highest in seven quarters, although they remain low compared to historical standards. Despite th...
Read full news article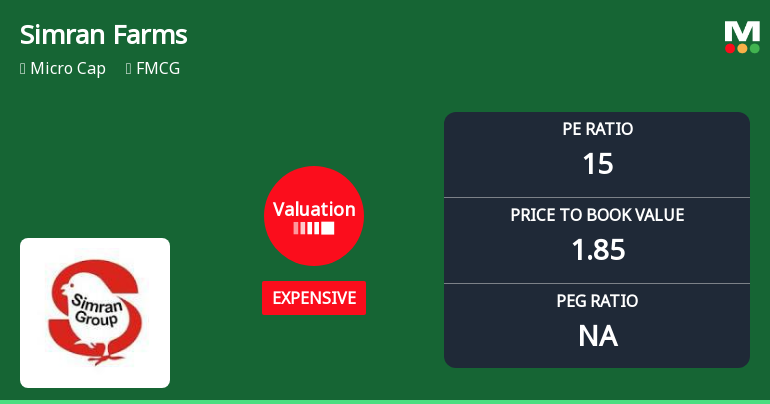
Simran Farms Ltd Valuation Shifts Signal Price Attractiveness Concerns
Simran Farms Ltd, a micro-cap player in the FMCG sector, has experienced a notable shift in its valuation parameters, moving from a risky to an expensive classification. This change, coupled with a recent downgrade in its Mojo Grade from Strong Sell to Sell, highlights growing concerns about the stock’s price attractiveness amid subdued financial performance and challenging market conditions.
Read full news article Announcements
Announcement under Regulation 30 (LODR)-Newspaper Publication
02-Jun-2026 | Source : BSEThe Company hereby submits Newspaper Publication of extract of Standalone and Consolidated Audited Financial Results for Quarter and Year ended 31st March 2026.
Board Meeting Outcome for Outcome Of Board Meeting Held On 30.05.2026
30-May-2026 | Source : BSEThe Company hereby submits Outcome of Board Meeting held on today i.e. 30.05.2026
Submission Of Audited Financial Results For Q4 And Year 31 Mar 2026
30-May-2026 | Source : BSEThe Company hereby submits audited financial results for Q4 and year ended 31st March 2026
Corporate Actions

No Upcoming Board Meetings

Simran Farms Ltd has declared 8% dividend, ex-date: 20 Sep 12

No Splits history available

No Bonus history available

No Rights history available
Quality key factors
Valuation key factors
Technicals key factors
 Technical Indicator Scale: Bearish, Mildly Bearish, Sideways, Mildly Bullish, Bullish Turned
 Shareholding Snapshot : Mar 2026
Shareholding Compare (%holding)
Non Institution
None
Held by 0 Schemes
Held by 0 FIIs
Harender Singh Bhatia (huf) (6.12%)
Ashwani Chowdhry (4.16%)
40.03%
Quarterly Results Snapshot (Consolidated) - Mar'26 - QoQ

QoQ Growth in quarter ended Mar 2026 is 6.91% vs 23.43% in Dec 2025
QoQ Growth in quarter ended Mar 2026 is 149.56% vs 222.86% in Dec 2025
Half Yearly Results Snapshot (Consolidated) - Sep'25
Growth in half year ended Sep 2025 is 12.07% vs 56.28% in Sep 2024
Growth in half year ended Sep 2025 is -87.61% vs 150.98% in Sep 2024
Nine Monthly Results Snapshot (Consolidated) - Dec'25
YoY Growth in nine months ended Dec 2025 is 5.01% vs 71.31% in Dec 2024
YoY Growth in nine months ended Dec 2025 is -75.38% vs 4,689.47% in Dec 2024
Annual Results Snapshot (Consolidated) - Mar'26
YoY Growth in year ended Mar 2026 is 4.83% vs 71.54% in Mar 2025
YoY Growth in year ended Mar 2026 is -13.95% vs 1,447.37% in Mar 2025
About Simran Farms Ltd

Company Coordinates


