
Compare SKM Egg Prod. with Similar Stocks
Dashboard
Strong ability to service debt as the company has a low Debt to EBITDA ratio of 0.88 times
Healthy long term growth as Operating profit has grown by an annual rate 67.03%
With a growth in Net Profit of 8.49%, the company declared Outstanding results in Mar 26
With ROE of 26.2, it has a Fair valuation with a 3.2 Price to Book Value
Market Beating performance in long term as well as near term
Total Returns (Price + Dividend) 
Latest dividend: 1.5 per share ex-dividend date: Aug-26-2025
Risk Adjusted Returns v/s
Returns Beta

News
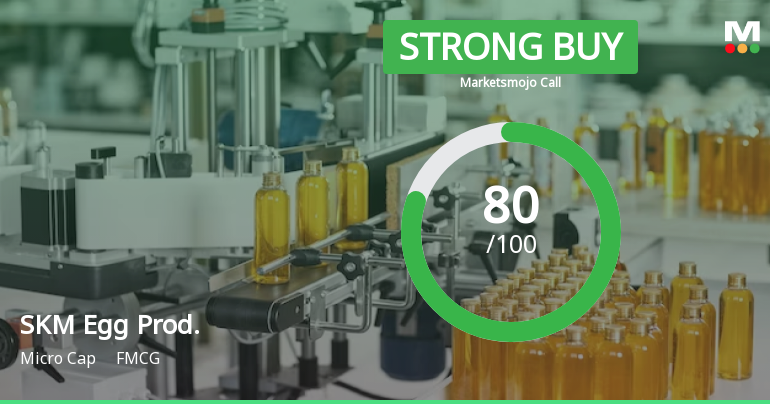
MarketsMOJO Upgrades SKM Egg Products Export to Strong Buy on Robust Financial and Technical Gains
SKM Egg Products Export (India) Ltd has been upgraded from a Buy to a Strong Buy rating, reflecting significant improvements across quality, valuation, financial trends, and technical indicators. This upgrade, effective from 10 June 2026, underscores the company’s outstanding financial performance, healthy growth trajectory, and increasingly bullish market signals, positioning it as a compelling micro-cap investment in the FMCG sector.
Read full news article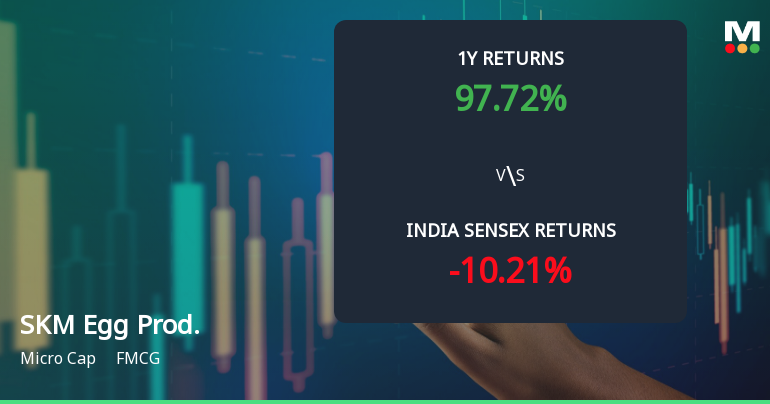
SKM Egg Products Export (India) Ltd Technical Momentum Shifts Signal Bullish Outlook
SKM Egg Products Export (India) Ltd has exhibited a notable shift in its technical momentum, moving from a mildly bullish stance to a more confident bullish trend. This transition is underscored by a convergence of positive signals across key technical indicators, including MACD, moving averages, and Bollinger Bands, despite some short-term bearishness in the RSI. The stock’s recent performance relative to the Sensex and its micro-cap status further contextualise its evolving market position.
Read full news article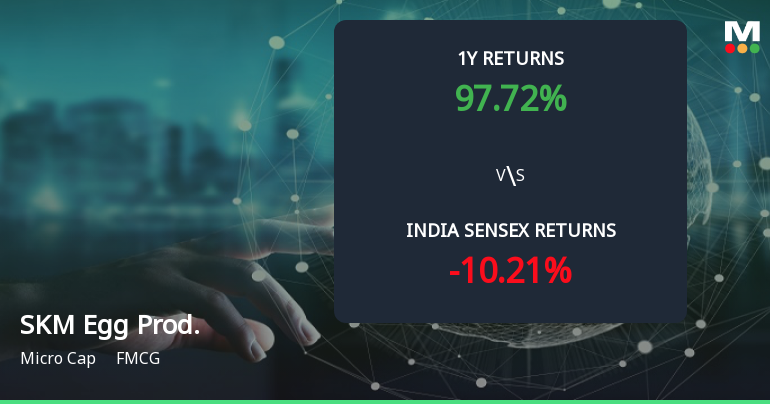
Golden Cross Forms in SKM Egg Products Export (India) Ltd — On a Day the Stock Fell 1.9%. What the Mixed Signals Mean
The 50-day moving average has crossed above the 200-day moving average for SKM Egg Products Export (India) Ltd, signalling a golden cross on 10 Jun 2026. Yet, the stock declined 1.9% on the day this technical event occurred, and some indicators present a nuanced picture. A golden cross that arrives amid such contradictions demands a thorough examination of the broader technical and fundamental context.
Read full news article Announcements
Announcement under Regulation 30 (LODR)-Earnings Call Transcript
28-May-2026 | Source : BSEConcall Transcript
Compliances-Reg.24(A)-Annual Secretarial Compliance
28-May-2026 | Source : BSEAnnual Secretarial Compliance Report for the year ended 31st March 2026
General Updates
26-May-2026 | Source : BSEGeneral Updates
Corporate Actions

No Upcoming Board Meetings

SKM Egg Products Export (India) Ltd has declared 15% dividend, ex-date: 26 Aug 25

SKM Egg Products Export (India) Ltd has announced 5:10 stock split, ex-date: 12 Jan 26

No Bonus history available

No Rights history available
Quality key factors
Valuation key factors
Technicals key factors
 Technical Indicator Scale: Bearish, Mildly Bearish, Sideways, Mildly Bullish, Bullish Turned
 Shareholding Snapshot : Mar 2026
Shareholding Compare (%holding)
Promoters
None
Held by 0 Schemes
Held by 6 FIIs (0.49%)
Skm Shree Shivkumar (45.56%)
Meherwan Adi Kotwal (2.01%)
30.6%
Quarterly Results Snapshot (Consolidated) - Mar'26 - QoQ

QoQ Growth in quarter ended Mar 2026 is -8.37% vs 0.88% in Dec 2025
QoQ Growth in quarter ended Mar 2026 is 8.79% vs 21.37% in Dec 2025
Half Yearly Results Snapshot (Consolidated) - Sep'25

Growth in half year ended Sep 2025 is 53.95% vs -36.44% in Sep 2024
Growth in half year ended Sep 2025 is 97.93% vs -67.44% in Sep 2024
Nine Monthly Results Snapshot (Consolidated) - Dec'25
YoY Growth in nine months ended Dec 2025 is 52.83% vs -29.41% in Dec 2024
YoY Growth in nine months ended Dec 2025 is 151.49% vs -62.50% in Dec 2024
Annual Results Snapshot (Consolidated) - Mar'26
YoY Growth in year ended Mar 2026 is 54.27% vs -29.00% in Mar 2025
YoY Growth in year ended Mar 2026 is 199.77% vs -59.48% in Mar 2025
About SKM Egg Products Export (India) Ltd

Company Coordinates


