Smiths & Founder

  • Market Cap: Micro Cap
  • Industry: Castings & Forgings
  • ISIN: INE728B01032
  • NSEID:
  • BSEID: 513418
INR
13.31
0.63 (4.97%)
BSENSE

Jul 29, 12:46 PM

BSE+NSE Vol: 6.04 lacs

  • Price Points
  • Score
  • Mojo Parameters
  • Total Return
  • News and Corporate Actions
  • Key factors
  • Shareholding
  • Financials
  • CompanyCV
stock-summaryPrice Point
High/Low

1Day

52 Week

Valuation
Technical
Day's Volume

CASH

6.04 lacs (512.38%) Volume

Shareholding (Jun 2026)

FII

0.00%

Held by 0 FIIs

DII

0.01%

Held by 0 DIIs

Promoter

28.69%

Why is Smiths & Founders (India) Ltd falling/rising?

29-Jul-2026

As of 28-Jul, Smiths & Founders (India) Ltd's stock price has risen to Rs.12.68, reflecting a 4.97% increase, driven by a consistent upward trend, strong investor confidence, and significant trading volume. The stock has achieved a 52-week high and outperformed its sector, indicating robust market interest.

As of 28-Jul, Smiths & Founders (India) Ltd is experiencing a rise in its stock price, currently at Rs.12.68, which reflects an increase of 0.6 or 4.97%. This upward movement can be attributed to several factors. Firstly, the stock has been on a consistent upward trend, gaining for the last 14 consecutive days and achieving a total return of 38.88% during this period. Additionally, the stock has outperformed its sector by 5.72% today.<BR><BR>Moreover, the stock has reached a new 52-week high of Rs.12.68, indicating strong investor confidence. The performance metrics over various periods further illustrate the stock's strength, with a year-to-date increase of 152.59% and a remarkable 983.76% rise over the past five years. <BR><BR>Investor participation has also surged, with a delivery volume of 3.83 lacs on 27 July, which is an increase of 1486.91% compared to the five-day average. This significant rise in trading volume suggests heightened interest and confidence among investors. Furthermore, the stock is trading above its moving averages across multiple time frames, reinforcing its bullish momentum. <BR><BR>Overall, these factors collectively contribute to the rising stock price of Smiths & Founders (India) Ltd.

View full answer

Are Smiths & Founders (India) Ltd latest results good or bad?

25-Jul-2026

Smiths & Founders (India) Ltd's latest results are concerning, showing a flat net profit of ₹0.26 crores year-on-year but a significant 58.06% decline from the previous quarter, alongside a slight revenue drop. While operating margins improved, the overall financial performance suggests challenges in profitability and market conditions, with high valuation metrics indicating potential overvaluation.

Smiths & Founders (India) Ltd's latest results present a mixed picture. In Q1 FY27, the company reported a net profit of ₹0.26 crores, which is flat compared to the same quarter last year but represents a significant decline of 58.06% from the previous quarter. This sharp drop in profit indicates challenges in maintaining profitability on a sequential basis.<BR><BR>On the revenue front, the company generated ₹3.22 crores, reflecting a slight year-on-year decline of 0.31% and a more pronounced sequential drop of 9.04%. This stagnation in revenue suggests subdued demand conditions in the castings sector, which is concerning.<BR><BR>However, there was a notable improvement in operating margin, which increased to 10.87% from a negative margin of 0.28% in the previous quarter. This recovery indicates better cost management and operational efficiency, although the year-on-year margin has compressed by 59 basis points, which is a point of concern.<BR><BR>Overall, while the company has managed to maintain some level of profitability and improve margins sequentially, the significant decline in net profit and revenue raises red flags about its operational performance and market conditions. The high valuation metrics, such as a P/E ratio of 175x compared to the industry average of 50x, further complicate the outlook, suggesting that the stock may be overvalued relative to its fundamentals. Therefore, the results can be seen as more negative than positive, particularly when considering the broader context of the company's financial health and market conditions.

View full answer

Should I buy, sell or hold Smiths & Founders (India) Ltd?

24-Jul-2026

What does Smiths & Founder do?

11-Jun-2026

Smiths & Founders (India) Ltd is a micro-cap company in the castings and forgings industry, established in 1982, with recent quarterly net sales of 4 Cr and net profit of 1 Cr as of March 2026. The company has a market cap of INR 78 Cr and key financial metrics include a P/E ratio of 109.00 and a return on equity of 3.15%.

Overview:<BR>Smiths & Founders (India) Ltd operates in the castings and forgings industry and is categorized as a micro-cap company.<BR><BR>History:<BR>The company was originally established in 1982 and underwent several name changes, becoming 'Shimoga Forge Limited' in 1990, 'Shimoga Technologies Limited' in 2002, and finally 'Smiths & Founders (India) Limited' on March 27, 2014. The latest quarterly results reported net sales and net profit for March 2026.<BR><BR>Financial Snapshot:<BR>Net Sales: 4 Cr (Quarterly Results - Mar 2026) <BR>Net Profit: 1 Cr (Quarterly Results - Mar 2026) <BR>Market Cap: INR 78 Cr (Micro Cap)<BR><BR>Key Metrics:<BR>P/E: 109.00 <BR>Industry P/E: 46 <BR>Dividend Yield: 0.00% <BR>Debt-Equity: -0.06 <BR>Return on Equity: 3.15% <BR>Price to Book: 3.61 <BR><BR>Contact Details:<BR>Address: No 505 5th Floor Brigade Rubix, No 20 HMT Main Road Bangalore Karnataka : 560013 <BR>Tel: 91-80-64503851/52 <BR>Email: mail@shimogatechnologies.com <BR>Website: http://www.smithsandfoundersindia.com

View full answer

How big is Smiths & Founder?

11-Jun-2026

As of 10th June, Smiths & Founders (India) Ltd has a market capitalization of 78.00 Cr, classified as a Micro Cap, with recent net sales of 13.99 Cr and net profit of 1.35 Cr over the latest four quarters.

As of 10th June, <BR><BR>Market Cap: Smiths & Founders (India) Ltd has a market capitalization of 78.00 Cr and is classified as a Micro Cap.<BR><BR>Recent Quarterly Performance: The sum of Net Sales for the latest 4 quarters is 13.99 Cr, while the sum of Net Profit for the same period is 1.35 Cr.<BR><BR>Balance Sheet Snapshot: The reporting period for the latest annual data is March 2025. Shareholder's Funds stand at 19.88 Cr, and Total Assets are valued at 22.30 Cr.

View full answer

Who are in the management team of Smiths & Founder?

11-Jun-2026

The management team of Smiths & Founder includes Suresh Shastry (Chairman & Managing Director), V Parthasarathy, Sudhindra N Kalghatgi, and Ramesh (Independent Directors), Shailaja Suresh (Non-Executive Director), and Roopashree B Shettigar (Company Secretary & Compliance Officer).

The management team of Smiths & Founder includes the following individuals:<BR><BR>1. **Suresh Shastry** - Chairman & Managing Director<BR>2. **V Parthasarathy** - Independent Director<BR>3. **Sudhindra N Kalghatgi** - Independent Director<BR>4. **Shailaja Suresh** - Non Executive Director<BR>5. **Roopashree B Shettigar** - Company Secretary & Compliance Officer<BR>6. **Ramesh** - Independent Director<BR><BR>If you have any more questions about the company or its operations, feel free to ask!

View full answer

Who are the peers of the Smiths & Founder?

11-Jun-2026

Peers of Smiths & Founder include Super Iron, Hilton Met.Forg., Creative Casting, Swastika Castal, Sharp Chucks, Paramount Specia, Forge Auto, and Deem Roll-Tech. Smiths & Founder has a 1-year return of 26.60%, lower than Super Iron's 30.43% and higher than Hilton Met.Forg.'s -65.93%.

Peers: The peers of Smiths & Founder are Super Iron, Hilton Met.Forg., Creative Casting, Swastika Castal, Sharp Chucks and, Paramount Specia, Forge Auto, and Deem Roll-Tech.<BR><BR>Quality Snapshot: Excellent management risk is observed at Swastika Castal and Forge Auto, while Average management risk is found at Creative Casting, Sharp Chucks and, and Deem Roll-Tech, and the rest. Below Average management risk is noted at Super Iron, Hilton Met.Forg., Smiths & Founder, and Paramount Specia. Growth is Excellent at Super Iron, Good at Swastika Castal and Forge Auto, Average at Hilton Met.Forg. and Creative Casting, and Below Average at Smiths & Founder, Sharp Chucks and, and Paramount Specia, and the rest. Capital Structure is Good at Creative Casting, Average at Smiths & Founder, Paramount Specia, and Forge Auto, and Below Average at Super Iron, Hilton Met.Forg., Sharp Chucks and, and the rest.<BR><BR>Return Snapshot: The peer with the highest 1-year return is Super Iron at 30.43%, while the lowest is Hilton Met.Forg. at -65.93%. Smiths & Founder has a 1-year return of 26.60%, which is higher than Hilton Met.Forg. but lower than Super Iron. Additionally, peers with negative six-month returns include Hilton Met.Forg., Swastika Castal, and Creative Casting.

View full answer

When is the next results date for Smiths & Founders (India) Ltd?

19-May-2026

The next results date for Smiths & Founders (India) Ltd is 25 May 2026.

The next results date for Smiths & Founders (India) Ltd is scheduled for 25 May 2026.

View full answer

Is Smiths & Founder overvalued or undervalued?

06-Nov-2025

As of November 4, 2025, Smiths & Founder is considered overvalued with a valuation grade of expensive, reflected by a PE ratio of 43.12 and an EV to EBITDA of 24.99, especially when compared to peers like Bharat Forge and CIE Automotive, and it has underperformed the Sensex with a 26.66% decline over the past year.

As of 4 November 2025, the valuation grade for Smiths & Founder has moved from very expensive to expensive. The company is currently considered overvalued based on its financial ratios. The PE ratio stands at 43.12, while the EV to EBITDA ratio is 24.99, and the PEG ratio is 2.36, indicating a high valuation relative to its earnings growth potential.<BR><BR>In comparison to its peers, Bharat Forge has a PE ratio of 61.77 and an EV to EBITDA of 25.67, while CIE Automotive, which is rated attractive, has a significantly lower PE ratio of 20.5 and an EV to EBITDA of 12.17. This suggests that Smiths & Founder is trading at a premium compared to some of its peers, which reinforces the conclusion of being overvalued. Additionally, the company's stock has underperformed against the Sensex, particularly over the year, where it has declined by 26.66% compared to a 5.94% gain in the index.

View full answer

How has been the historical performance of Smiths & Founder?

03-Nov-2025

Smiths & Founder has shown growth in net sales and profitability from Mar'23 to Mar'25, with net sales increasing from 10.46 Cr to 13.22 Cr and profit after tax rising from 0.24 Cr to 1.05 Cr. However, total assets slightly declined, and total debt significantly decreased, indicating improved financial health amidst fluctuations.

Answer:<BR>The historical performance of Smiths & Founder shows a mixed trend over the years, with notable fluctuations in revenue and profitability.<BR><BR>Breakdown:<BR>Smiths & Founder has experienced growth in net sales, increasing from 10.46 Cr in Mar'23 to 13.22 Cr in Mar'25. However, total operating income followed a similar upward trajectory, reaching 13.22 Cr in Mar'25, up from 10.46 Cr in Mar'23. The total expenditure also rose, from 9.68 Cr in Mar'23 to 11.50 Cr in Mar'25, impacting operating profit, which saw an increase to 1.79 Cr in Mar'25 from 0.79 Cr in Mar'23. Profit before tax improved significantly from 0.24 Cr in Mar'23 to 1.42 Cr in Mar'25, while profit after tax also rose to 1.05 Cr in Mar'25 from 0.24 Cr in Mar'23. The company's total assets were stable, recorded at 22.30 Cr in Mar'25, slightly down from 22.94 Cr in Mar'24. Notably, total debt decreased from 2.91 Cr in Mar'23 to 0.41 Cr in Mar'25, indicating improved financial health. Overall, while Smiths & Founder has shown growth in sales and profitability, its asset base and total liabilities have seen fluctuations, reflecting a complex financial landscape.

View full answer

Who are the top shareholders of the Smiths & Founder?

17-Jul-2025

The top shareholders of Smiths & Founder are Suresh Shastry with 28.64%, Supriya Shastry with 18.27%, and individual investors holding 10.83%. There are no institutional or mutual fund holdings.

The top shareholders of Smiths & Founder include Suresh Shastry, who holds the largest share at 28.64%. Following him is Supriya Shastry, with an 18.27% stake. Additionally, individual investors collectively hold 10.83% of the company's shares. There are no institutional holdings or mutual funds involved in the shareholding structure.

View full answer

What is the technical trend for Smiths & Founder?

09-Jun-2025

As of May 30, 2025, Smiths & Founder is in a moderately bearish trend, indicated by a bearish MACD and moving averages, with the current price at 5.88, down from 5.92.

As of 30 May 2025, the technical trend for Smiths & Founder has changed from mildly bearish to bearish. The current stance is bearish with a moderate strength. Key indicators driving this include a bearish MACD on the weekly chart and bearish moving averages on the daily chart. The Bollinger Bands also reflect a mildly bearish trend on both weekly and monthly time frames. The KST shows a mildly bullish signal on the weekly but is mildly bearish on the monthly, indicating some mixed signals. Overall, the bearish trend is supported by the recent price action, with the current price at 5.88, down from the previous close of 5.92.

View full answer

Has Smiths & Founder declared dividend?

06-Jun-2025

No Dividend History Available

iScoreScore
Click here to find our call on this stock
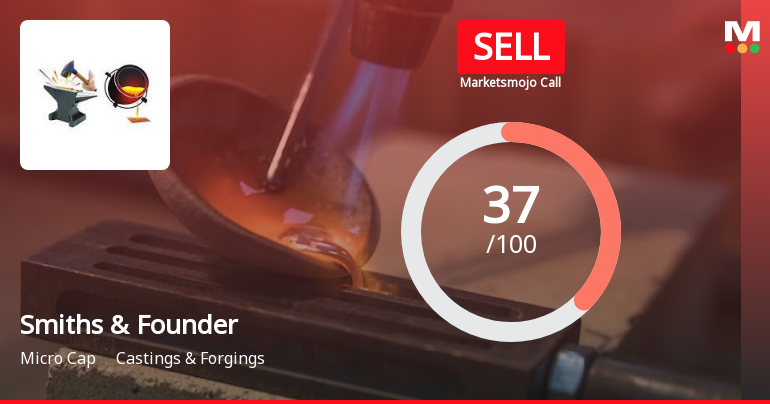
Strong Sell
Sell
Hold
Buy
Strong Buy

Dashboard

1

Weak Long Term Fundamental Strength with a -3.62% CAGR growth in Operating Profits over the last 5 years

  • Company's ability to service its debt is weak with a poor EBIT to Interest (avg) ratio of 1.05
  • The company has been able to generate a Return on Equity (avg) of 8.89% signifying low profitability per unit of shareholders funds
2

Flat results in Jun 26

 
3

With ROE of 3.2, it has a Very Expensive valuation with a 6.1 Price to Book Value

stock-summaryMojo Parameters

Mojo Parameters

Loading Valuation Snapshot...

Stock DNA

stock-summary
Industry

Castings & Forgings

stock-summary
Market cap

INR 136 Cr (Micro Cap)

stock-summary
P/E

193.00

stock-summary
Industry P/E

49

stock-summary
Dividend Yield

0.00%

stock-summary
Debt Equity

-0.06

stock-summary
Return on Equity

3.15%

stock-summary
Price to Book

6.07

Revenue and Profits:
Net Sales:
3 Cr
(Quarterly Results - Jun 2026)
Net Profit:
0 Cr
stock-summaryTotal Returns
Total Returns (Price + Dividend) stock-summary
Dividend Yield (0%)
TimePeriod
Price Return
Dividend Return
Total Return
3 Months
173.87%
0%
173.87%
6 Months
168.35%
0%
168.35%
1 Year
157.45%
0%
157.45%
2 Years
119.64%
0%
119.64%
3 Years
278.13%
0%
278.13%
4 Years
138.96%
0%
138.96%
5 Years
990.98%
0%
990.98%

Smiths & Founder for the last several years.

Risk Adjusted Returns v/s stock-summary
Returns Beta
Icon
Beta has not been calculated since enough price history is not available
stock-summaryNews & Corporate Actions

Announcements stock-summary

Announcement under Regulation 30 (LODR)-Newspaper Publication

25-Jul-2026 | Source : BSE

PFA the Un-audited Financial Results for the quarter ended June 30 2026 in the Newspapers viz. Kannada Prabha and Business Standard

Announcement under Regulation 30 (LODR)-Change in Directorate

24-Jul-2026 | Source : BSE

PFA the Announcement under Regulation 30 (LODR) - Change in Directorate

Board Meeting Outcome for Board Meeting Outcome For Intimation Of Outcome Of The Board Meeting Held On 24.07.2026

24-Jul-2026 | Source : BSE

The Board of Directors of the Company at its meeting held today have inter-alia considered and approved the Unaudited Financial Results for the quarter ended 30.06.2026. The meeting commenced at 12.00 P.M and concluded at 12.30 P.M.

Corporate Actions stock-summary

stock-summary
BOARD MEETING

No Upcoming Board Meetings

stock-summary
DIVIDEND

No Dividend history available

stock-summary
SPLITS

No Splits history available

stock-summary
BONUS

No Bonus history available

stock-summary
RIGHTS

No Rights history available

stock-summaryKey Factors

Quality key factors stock-summary

Factor
Value
Sales Growth (5y)
6.45%
EBIT Growth (5y)
-3.62%
EBIT to Interest (avg)
1.05
Debt to EBITDA (avg)
1.69
Net Debt to Equity (avg)
-0.06
Sales to Capital Employed (avg)
0.75
Tax Ratio
27.96%
Dividend Payout Ratio
0
Pledged Shares
0
Institutional Holding
0.01%
ROCE (avg)
7.96%
ROE (avg)
8.89%

Valuation key factors

Factor
Value
P/E Ratio
193
Industry P/E
49
Price to Book Value
6.07
EV to EBIT
127.95
EV to EBITDA
110.30
EV to Capital Employed
6.42
EV to Sales
9.15
PEG Ratio
NA
Dividend Yield
NA
ROCE (Latest)
4.57%
ROE (Latest)
3.15%

Technicals key factors

Indicator
Weekly
Monthly
MACD
Bullish
Bullish
RSI
No Signal
No Signal
Bollinger Bands
Bullish
Bullish
Moving Averages
Bullish (Daily)
KST
Bullish
Bullish
Dow Theory
Mildly Bullish
Mildly Bullish
stock-summary Technical Indicator Scale: Bearish, Mildly Bearish, Sideways, Mildly Bullish, Bullish  Turned 
stock-summaryShareholding
Shareholding Snapshot : Jun 2026stock-summary
Shareholding Compare (%holding) stock-summary
Majority shareholders

Non Institution

Pledged Promoter Holdings

None

Mutual Funds

Held by 0 Schemes

FIIs

Held by 0 FIIs

Promoter with highest holding

Suresh Shastry (28.64%)

Highest Public shareholder

Supriya S (18.06%)

Individual Investors Holdings

11.05%

stock-summaryFinancial
[
  {
    "link": "quarterly",
    "btn_text": "All Quarterly Results",
    "header": "Quarterly Results Snapshot (Standalone) - Jun'26 - QoQ",
    "rhs": [
      {
        "prefix": "Net Sales ",
        "suffix": "QoQ Growth in quarter ended Jun 2026 is -9.04% vs 4.12% in Mar 2026",
        "dir": -1
      },
      {
        "prefix": "Standalone Net Profit ",
        "suffix": "QoQ Growth in quarter ended Jun 2026 is -58.06% vs 158.33% in Mar 2026",
        "dir": -1
      }
    ],
    "table": {
      "header": [
        "Jun'26",
        "Mar'26",
        "Change(%)"
      ],
      "body": [
        {
          "field": "Net Sales",
          "val1": "3.22",
          "val2": "3.54",
          "chgp": "-9.04%",
          "chgp_class": "negative"
        },
        {
          "field": "Operating Profit (PBDIT) excl Other Income",
          "val1": "0.35",
          "val2": "-0.01",
          "chgp": "3,600.00%",
          "chgp_class": "positive"
        },
        {
          "field": "Interest",
          "val1": "0.00",
          "val2": "0.02",
          "chgp": "-100.00%",
          "chgp_class": "positive"
        },
        {
          "field": "Exceptional Items",
          "val1": "0.00",
          "val2": "0.93",
          "chgp": "-100.00%",
          "chgp_class": "negative"
        },
        {
          "field": "Standalone Net Profit",
          "val1": "0.26",
          "val2": "0.62",
          "chgp": "-58.06%",
          "chgp_class": "negative"
        },
        {
          "field": "Operating Profit Margin (Excl OI)",
          "val1": "10.87%",
          "val2": "-0.28%",
          "chgp": "11.15%",
          "chgp_class": "positive"
        }
      ]
    }
  },
  {
    "link": "half-yearly",
    "btn_text": "All Half Yearly Results",
    "header": "Half Yearly Results Snapshot (Standalone) - Sep'25",
    "rhs": [
      {
        "prefix": "Net Sales ",
        "suffix": " Growth in half year ended Sep 2025 is 4.60% vs 20.36% in Sep 2024",
        "dir": -1
      },
      {
        "prefix": "Standalone Net Profit ",
        "suffix": " Growth in half year ended Sep 2025 is -25.37% vs 148.15% in Sep 2024",
        "dir": -1
      }
    ],
    "table": {
      "header": [
        "Sep'25",
        "Sep'24",
        "Change(%)"
      ],
      "body": [
        {
          "field": "Net Sales",
          "val1": "7.05",
          "val2": "6.74",
          "chgp": "4.60%",
          "chgp_class": "positive"
        },
        {
          "field": "Operating Profit (PBDIT) excl Other Income",
          "val1": "0.78",
          "val2": "0.83",
          "chgp": "-6.02%",
          "chgp_class": "negative"
        },
        {
          "field": "Interest",
          "val1": "0.00",
          "val2": "0.09",
          "chgp": "-100.00%",
          "chgp_class": "positive"
        },
        {
          "field": "Exceptional Items",
          "val1": "0.00",
          "val2": "0.00",
          "chgp": "",
          "chgp_class": "neutral"
        },
        {
          "field": "Standalone Net Profit",
          "val1": "0.50",
          "val2": "0.67",
          "chgp": "-25.37%",
          "chgp_class": "negative"
        },
        {
          "field": "Operating Profit Margin (Excl OI)",
          "val1": "11.06%",
          "val2": "12.31%",
          "chgp": "-1.25%",
          "chgp_class": "negative"
        }
      ]
    }
  },
  {
    "link": "nine-monthly",
    "btn_text": "All Nine Monthly Results",
    "header": "Nine Monthly Results Snapshot (Standalone) - Dec'25",
    "rhs": [
      {
        "prefix": "Net Sales ",
        "suffix": "YoY Growth in nine months ended Dec 2025 is 4.92% vs 16.63% in Dec 2024",
        "dir": -1
      },
      {
        "prefix": "Standalone Net Profit ",
        "suffix": "YoY Growth in nine months ended Dec 2025 is -28.85% vs 181.08% in Dec 2024",
        "dir": -1
      }
    ],
    "table": {
      "header": [
        "Dec'25",
        "Dec'24",
        "Change(%)"
      ],
      "body": [
        {
          "field": "Net Sales",
          "val1": "10.45",
          "val2": "9.96",
          "chgp": "4.92%",
          "chgp_class": "positive"
        },
        {
          "field": "Operating Profit (PBDIT) excl Other Income",
          "val1": "1.18",
          "val2": "1.27",
          "chgp": "-7.09%",
          "chgp_class": "negative"
        },
        {
          "field": "Interest",
          "val1": "0.00",
          "val2": "0.12",
          "chgp": "-100.00%",
          "chgp_class": "positive"
        },
        {
          "field": "Exceptional Items",
          "val1": "0.00",
          "val2": "0.00",
          "chgp": "",
          "chgp_class": "neutral"
        },
        {
          "field": "Standalone Net Profit",
          "val1": "0.74",
          "val2": "1.04",
          "chgp": "-28.85%",
          "chgp_class": "negative"
        },
        {
          "field": "Operating Profit Margin (Excl OI)",
          "val1": "11.29%",
          "val2": "12.75%",
          "chgp": "-1.46%",
          "chgp_class": "negative"
        }
      ]
    }
  },
  {
    "link": "annual",
    "btn_text": "All Annual Results",
    "header": "Annual Results Snapshot (Standalone) - Mar'26",
    "rhs": [
      {
        "prefix": "Net Sales ",
        "suffix": "YoY Growth in year ended Mar 2026 is 5.75% vs 13.38% in Mar 2025",
        "dir": -1
      },
      {
        "prefix": "Standalone Net Profit ",
        "suffix": "YoY Growth in year ended Mar 2026 is 29.52% vs 66.67% in Mar 2025",
        "dir": -1
      }
    ],
    "table": {
      "header": [
        "Mar'26",
        "Mar'25",
        "Change(%)"
      ],
      "body": [
        {
          "field": "Net Sales",
          "val1": "13.98",
          "val2": "13.22",
          "chgp": "5.75%",
          "chgp_class": "positive"
        },
        {
          "field": "Operating Profit (PBDIT) excl Other Income",
          "val1": "1.15",
          "val2": "1.72",
          "chgp": "-33.14%",
          "chgp_class": "negative"
        },
        {
          "field": "Interest",
          "val1": "0.02",
          "val2": "0.13",
          "chgp": "-84.62%",
          "chgp_class": "positive"
        },
        {
          "field": "Exceptional Items",
          "val1": "0.93",
          "val2": "0.00",
          "chgp": "",
          "chgp_class": "neutral"
        },
        {
          "field": "Standalone Net Profit",
          "val1": "1.36",
          "val2": "1.05",
          "chgp": "29.52%",
          "chgp_class": "positive"
        },
        {
          "field": "Operating Profit Margin (Excl OI)",
          "val1": "8.23%",
          "val2": "13.01%",
          "chgp": "-4.78%",
          "chgp_class": "negative"
        }
      ]
    }
  }
]

Quarterly Results Snapshot (Standalone) - Jun'26 - QoQstock-summary

Jun'26
Mar'26
Change(%)
Net Sales
3.22
3.54
-9.04%
Operating Profit (PBDIT) excl Other Income
0.35
-0.01
3,600.00%
Interest
0.00
0.02
-100.00%
Exceptional Items
0.00
0.93
-100.00%
Standalone Net Profit
0.26
0.62
-58.06%
Operating Profit Margin (Excl OI)
10.87%
-0.28%
11.15%
Values in Rs Cr.
Direction Arrows
Net Sales

QoQ Growth in quarter ended Jun 2026 is -9.04% vs 4.12% in Mar 2026

Direction Arrows
Standalone Net Profit

QoQ Growth in quarter ended Jun 2026 is -58.06% vs 158.33% in Mar 2026

Half Yearly Results Snapshot (Standalone) - Sep'25stock-summary

Sep'25
Sep'24
Change(%)
Net Sales
7.05
6.74
4.60%
Operating Profit (PBDIT) excl Other Income
0.78
0.83
-6.02%
Interest
0.00
0.09
-100.00%
Exceptional Items
0.00
0.00
Standalone Net Profit
0.50
0.67
-25.37%
Operating Profit Margin (Excl OI)
11.06%
12.31%
-1.25%
Values in Rs Cr.
Direction Arrows
Net Sales

Growth in half year ended Sep 2025 is 4.60% vs 20.36% in Sep 2024

Direction Arrows
Standalone Net Profit

Growth in half year ended Sep 2025 is -25.37% vs 148.15% in Sep 2024

Nine Monthly Results Snapshot (Standalone) - Dec'25stock-summary

Dec'25
Dec'24
Change(%)
Net Sales
10.45
9.96
4.92%
Operating Profit (PBDIT) excl Other Income
1.18
1.27
-7.09%
Interest
0.00
0.12
-100.00%
Exceptional Items
0.00
0.00
Standalone Net Profit
0.74
1.04
-28.85%
Operating Profit Margin (Excl OI)
11.29%
12.75%
-1.46%
Values in Rs Cr.
Direction Arrows
Net Sales

YoY Growth in nine months ended Dec 2025 is 4.92% vs 16.63% in Dec 2024

Direction Arrows
Standalone Net Profit

YoY Growth in nine months ended Dec 2025 is -28.85% vs 181.08% in Dec 2024

Annual Results Snapshot (Standalone) - Mar'26stock-summary

Mar'26
Mar'25
Change(%)
Net Sales
13.98
13.22
5.75%
Operating Profit (PBDIT) excl Other Income
1.15
1.72
-33.14%
Interest
0.02
0.13
-84.62%
Exceptional Items
0.93
0.00
Standalone Net Profit
1.36
1.05
29.52%
Operating Profit Margin (Excl OI)
8.23%
13.01%
-4.78%
Values in Rs Cr.
Direction Arrows
Net Sales

YoY Growth in year ended Mar 2026 is 5.75% vs 13.38% in Mar 2025

Direction Arrows
Standalone Net Profit

YoY Growth in year ended Mar 2026 is 29.52% vs 66.67% in Mar 2025

stock-summaryCompany CV
About Smiths & Founders (India) Ltd stock-summary
stock-summary
Smiths & Founders (India) Ltd
Micro Cap
Castings & Forgings
Smiths & Founders (India) Limited was originally established as a small enterprise in year 1982. It was further reconstituted as 'Shimoga Forge Limited' in October, 1990, which changed to 'Shimoga Technologies Limited' on January 3, 2002 and upon the merger process, the Company was later changed to 'Smiths & Founders (India) Limited' on 27 March, 2014.
Company Coordinates stock-summary
Company Details
No 505 5th Floor Brigade Rubix, No 20 HMT Main Road Bangalore Karnataka : 560013
stock-summary
Tel: 91-80-64503851/52
stock-summary
mail@shimogatechnologies.com
Registrar Details
Integrated Enterprises (India) Ltd , 30, Ramana Residency, 4th Cross, Sampige Road, Malleswaram, Bangalore