
Compare Smiths & Founder with Similar Stocks
Dashboard
Weak Long Term Fundamental Strength with a -3.62% CAGR growth in Operating Profits over the last 5 years
- Company's ability to service its debt is weak with a poor EBIT to Interest (avg) ratio of 1.05
- The company has been able to generate a Return on Equity (avg) of 8.89% signifying low profitability per unit of shareholders funds
Flat results in Jun 26
With ROE of 3.2, it has a Very Expensive valuation with a 6.1 Price to Book Value
Stock DNA
Castings & Forgings
INR 136 Cr (Micro Cap)
193.00
49
0.00%
-0.06
3.15%
6.07
Total Returns (Price + Dividend) 
Smiths & Founder for the last several years.
Risk Adjusted Returns v/s
Returns Beta

News
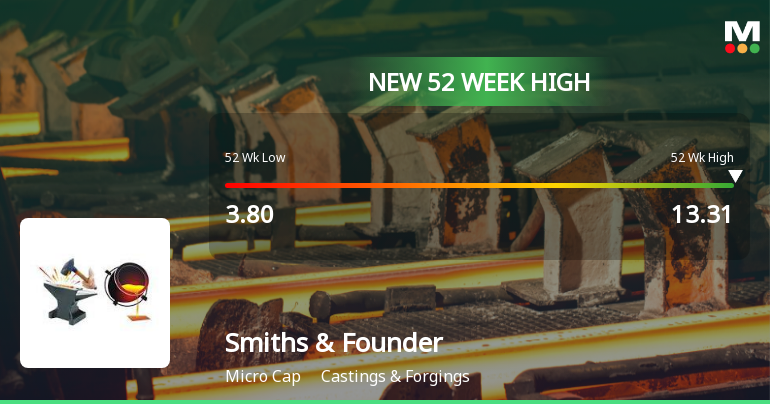
Broad-Based Technical Strength Lifts Smiths & Founders (India) Ltd to 52-Week High of Rs 13.31
Surging to a new 52-week high of Rs 13.31 on 29 Jul 2026, Smiths & Founders (India) Ltd has demonstrated remarkable price momentum, outpacing its sector and the broader market with a 42.39% gain over the past 15 trading sessions.
Read full news article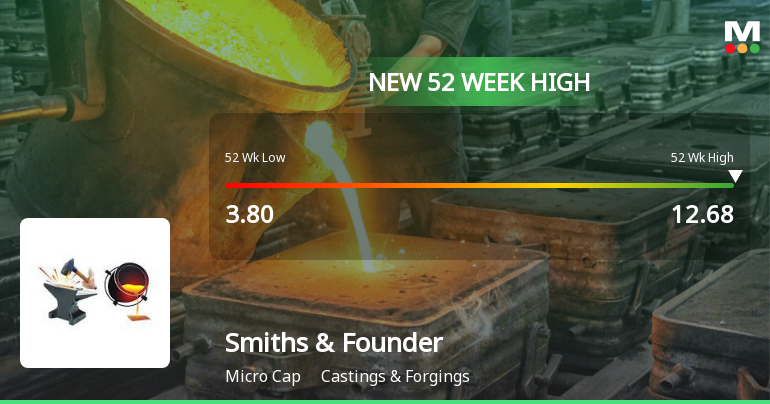
Broad-Based Technical Strength Lifts Smiths & Founders (India) Ltd to 52-Week High of Rs 12.68
From a 52-week low of Rs 3.80 to a fresh high of Rs 12.68, Smiths & Founders (India) Ltd has surged an impressive 146.21% over the past year, significantly outperforming the Sensex which declined by 4.96% in the same period. This remarkable rally culminated in the stock hitting its new 52-week peak today, fuelled by a confluence of strong technical signals and sustained price momentum.
Read full news article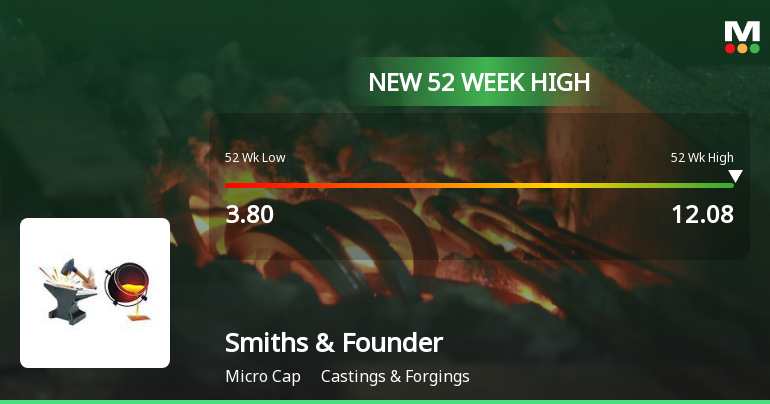
Broad-Based Technical Strength Lifts Smiths & Founders (India) Ltd to 52-Week High of Rs 12.08
From a low of Rs 3.80 to a fresh peak of Rs 12.08, Smiths & Founders (India) Ltd has surged an impressive 138.26% over the past year, vastly outperforming the Sensex which declined 5.85% in the same period. This remarkable rally culminated in the stock hitting a new 52-week high on 27 Jul 2026, fuelled by a confluence of strong technical signals and sustained price momentum.
Read full news article Announcements
Announcement under Regulation 30 (LODR)-Newspaper Publication
25-Jul-2026 | Source : BSEPFA the Un-audited Financial Results for the quarter ended June 30 2026 in the Newspapers viz. Kannada Prabha and Business Standard
Announcement under Regulation 30 (LODR)-Change in Directorate
24-Jul-2026 | Source : BSEPFA the Announcement under Regulation 30 (LODR) - Change in Directorate
Board Meeting Outcome for Board Meeting Outcome For Intimation Of Outcome Of The Board Meeting Held On 24.07.2026
24-Jul-2026 | Source : BSEThe Board of Directors of the Company at its meeting held today have inter-alia considered and approved the Unaudited Financial Results for the quarter ended 30.06.2026. The meeting commenced at 12.00 P.M and concluded at 12.30 P.M.
Corporate Actions

No Upcoming Board Meetings

No Dividend history available

No Splits history available

No Bonus history available

No Rights history available
Quality key factors
Valuation key factors
Technicals key factors
 Technical Indicator Scale: Bearish, Mildly Bearish, Sideways, Mildly Bullish, Bullish Turned
 Shareholding Snapshot : Jun 2026
Shareholding Compare (%holding)
Non Institution
None
Held by 0 Schemes
Held by 0 FIIs
Suresh Shastry (28.64%)
Supriya S (18.06%)
11.05%
Quarterly Results Snapshot (Standalone) - Jun'26 - QoQ

QoQ Growth in quarter ended Jun 2026 is -9.04% vs 4.12% in Mar 2026
QoQ Growth in quarter ended Jun 2026 is -58.06% vs 158.33% in Mar 2026
Half Yearly Results Snapshot (Standalone) - Sep'25
Growth in half year ended Sep 2025 is 4.60% vs 20.36% in Sep 2024
Growth in half year ended Sep 2025 is -25.37% vs 148.15% in Sep 2024
Nine Monthly Results Snapshot (Standalone) - Dec'25
YoY Growth in nine months ended Dec 2025 is 4.92% vs 16.63% in Dec 2024
YoY Growth in nine months ended Dec 2025 is -28.85% vs 181.08% in Dec 2024
Annual Results Snapshot (Standalone) - Mar'26
YoY Growth in year ended Mar 2026 is 5.75% vs 13.38% in Mar 2025
YoY Growth in year ended Mar 2026 is 29.52% vs 66.67% in Mar 2025
About Smiths & Founders (India) Ltd

Company Coordinates


