
Compare Smiths & Founder with Similar Stocks
Dashboard
With a Operating Losses, the company has a Weak Long Term Fundamental Strength
- Poor long term growth as Net Sales has grown by an annual rate of 9.67% and Operating profit at 4.56% over the last 5 years
- Company's ability to service its debt is weak with a poor EBIT to Interest (avg) ratio of 1.05
Flat results in Mar 26
With ROE of 3.2, it has a Very Expensive valuation with a 3.4 Price to Book Value
Stock DNA
Castings & Forgings
INR 78 Cr (Micro Cap)
109.00
46
0.00%
-0.06
3.15%
3.61
Total Returns (Price + Dividend) 
Smiths & Founder for the last several years.
Risk Adjusted Returns v/s
Returns Beta

News
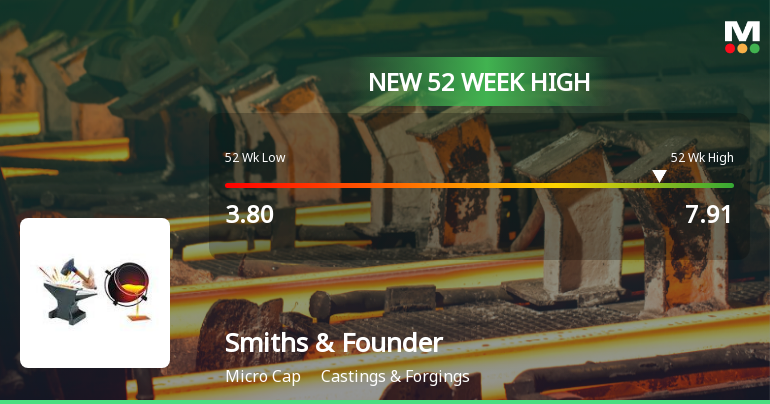
Broad-Based Technical Strength Lifts Smiths & Founders (India) Ltd to 52-Week High of Rs 7.91
Surging to a fresh 52-week high of Rs 7.91 on 10 Jun 2026, Smiths & Founders (India) Ltd has demonstrated remarkable price momentum, outperforming its sector and the broader market over the past year. The stock’s sustained rally, marked by a 66.96% gain over the last 10 trading sessions, reflects a strong alignment of technical indicators across multiple timeframes.
Read full news article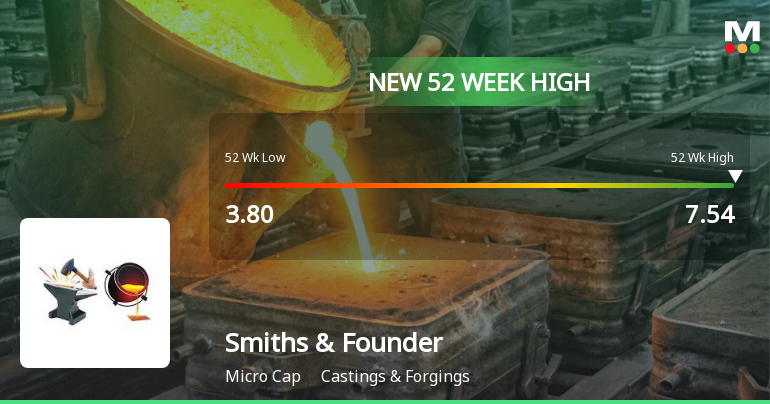
Broad-Based Technical Strength Lifts Smiths & Founders (India) Ltd to 52-Week High of Rs 7.54
After a sustained rally spanning nine consecutive sessions, Smiths & Founders (India) Ltd surged to a fresh 52-week high of Rs 7.54 on 09 Jun 2026, marking a remarkable 63.91% gain over this period. This momentum has propelled the stock well above its 52-week low of Rs 3.80, underscoring a powerful technical uptrend that stands out amid a broadly subdued market backdrop.
Read full news article
Smiths & Founders (India) Ltd Upgraded to Sell on Technical Improvements Despite Weak Fundamentals
Smiths & Founders (India) Ltd has seen its investment rating upgraded from Strong Sell to Sell as of 8 June 2026, driven primarily by a shift in technical indicators despite persistent fundamental challenges. The micro-cap player in the Castings & Forgings sector continues to grapple with flat financial performance and weak long-term fundamentals, yet recent technical signals have improved, prompting a reassessment of its market stance.
Read full news article Announcements
Revised Financial Results For The Quarter And Year Ended 31St March 2026
30-May-2026 | Source : BSEPFA the Revised Financial Results for the quarter and year ended 31st March 2026
Announcement under Regulation 30 (LODR)-Newspaper Publication
26-May-2026 | Source : BSEPlease find attached the Audited Financial results as on 31.03.2026 in the Newspapers viz. Kannada Prabha and Business Standard.
Compliances-Reg.24(A)-Annual Secretarial Compliance
26-May-2026 | Source : BSEPFA the Annual Secretarial Compliance Report for the year ended 31st March 2026
Corporate Actions

No Upcoming Board Meetings

No Dividend history available

No Splits history available

No Bonus history available

No Rights history available
Quality key factors
Valuation key factors
Technicals key factors
 Technical Indicator Scale: Bearish, Mildly Bearish, Sideways, Mildly Bullish, Bullish Turned
 Shareholding Snapshot : Mar 2026
Shareholding Compare (%holding)
Non Institution
None
Held by 0 Schemes
Held by 0 FIIs
Suresh Shastry (28.64%)
Supriya S (18.27%)
10.96%
Quarterly Results Snapshot (Standalone) - Mar'26 - QoQ

QoQ Growth in quarter ended Mar 2026 is 4.12% vs -10.99% in Dec 2025
QoQ Growth in quarter ended Mar 2026 is 158.33% vs 4.35% in Dec 2025
Half Yearly Results Snapshot (Standalone) - Sep'25

Growth in half year ended Sep 2025 is 4.60% vs 20.36% in Sep 2024
Growth in half year ended Sep 2025 is -25.37% vs 148.15% in Sep 2024
Nine Monthly Results Snapshot (Standalone) - Dec'25
YoY Growth in nine months ended Dec 2025 is 4.92% vs 16.63% in Dec 2024
YoY Growth in nine months ended Dec 2025 is -28.85% vs 181.08% in Dec 2024
Annual Results Snapshot (Standalone) - Mar'26
YoY Growth in year ended Mar 2026 is 5.75% vs 13.38% in Mar 2025
YoY Growth in year ended Mar 2026 is 29.52% vs 66.67% in Mar 2025
About Smiths & Founders (India) Ltd

Company Coordinates


