
Compare SML Mahindra with Similar Stocks
Dashboard
Healthy long term growth as Net Sales has grown by an annual rate of 36.84% and Operating profit at 31.80%
Positive results in Mar 26
With ROCE of 28.7, it has a Expensive valuation with a 7.9 Enterprise value to Capital Employed
Increasing Participation by Institutional Investors
Consistent Returns over the last 3 years
Stock DNA
Automobiles
INR 5,885 Cr (Small Cap)
37.00
26
0.57%
0.52
30.76%
11.46
Total Returns (Price + Dividend) 
Latest dividend: 23.458194022129984 per share ex-dividend date: Jul-03-2026
Risk Adjusted Returns v/s
Returns Beta

News

SML Mahindra Ltd is Rated Hold by MarketsMOJO
SML Mahindra Ltd is rated 'Hold' by MarketsMOJO, with this rating last updated on 27 Oct 2025. However, the analysis and financial metrics discussed here reflect the company’s current position as of 16 July 2026, providing investors with an up-to-date perspective on the stock’s fundamentals, returns, and overall outlook.
Read full news article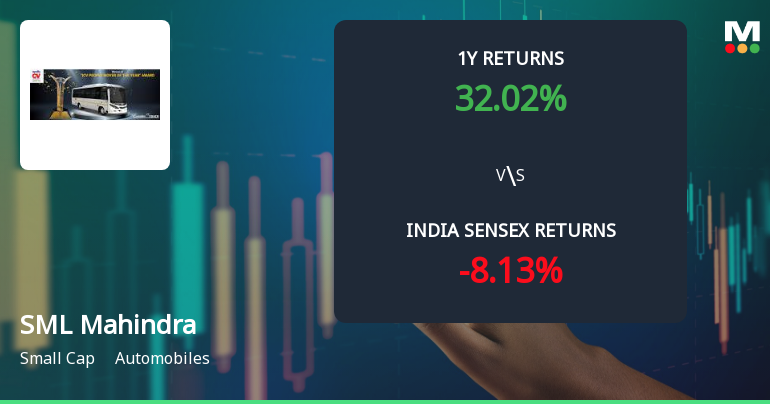
SML Mahindra Ltd Technical Momentum Shifts Signal Bullish Outlook Amid Market Recovery
SML Mahindra Ltd, a small-cap player in the automobile sector, has demonstrated a notable shift in price momentum and technical indicators, signalling a transition from a mildly bullish to a bullish trend. The stock’s recent 4.00% day gain to ₹4,042.20, coupled with upgrades in key technical parameters, suggests renewed investor interest and potential for further upside.
Read full news article
SML Mahindra Ltd is Rated Hold
SML Mahindra Ltd is rated 'Hold' by MarketsMOJO, with this rating last updated on 27 Oct 2025. However, the analysis and financial metrics discussed here reflect the stock's current position as of 05 July 2026, providing investors with an up-to-date perspective on the company’s fundamentals, returns, and market standing.
Read full news article Announcements
Announcement under Regulation 30 (LODR)-Monthly Business Updates
08-Jul-2026 | Source : BSEReport for the month of June 2026
Compliances-Certificate under Reg. 74 (5) of SEBI (DP) Regulations 2018
06-Jul-2026 | Source : BSECertificate under Reg. 74(5) of SEBI (DP) Regulations 2018 for quarter ended June 2026
Announcement under Regulation 30 (LODR)-Monthly Business Updates
01-Jul-2026 | Source : BSESales Fig for the month of June 2026
Corporate Actions

20 Jul 2026

SML Mahindra Ltd has declared 235% dividend, ex-date: 03 Jul 26

No Splits history available

No Bonus history available

SML Mahindra Ltd has announced 19:50 rights issue, ex-date: 09 Feb 10
Quality key factors
Valuation key factors
Technicals key factors
 Technical Indicator Scale: Bearish, Mildly Bearish, Sideways, Mildly Bullish, Bullish Turned
 Shareholding Snapshot : Mar 2026
Shareholding Compare (%holding)
Promoters
None
Held by 5 Schemes (0.12%)
Held by 45 FIIs (0.77%)
Mahindra & Mahindra Limited (58.97%)
Sachin Bansal (partner Of Navodaya Enterprises) (4.9%)
32.5%
Quarterly Results Snapshot (Standalone) - Mar'26 - YoY

YoY Growth in quarter ended Mar 2026 is 16.45% vs 13.42% in Mar 2025
YoY Growth in quarter ended Mar 2026 is 2.36% vs 1.20% in Mar 2025
Half Yearly Results Snapshot (Standalone) - Sep'25

Growth in half year ended Sep 2025 is 8.12% vs 14.65% in Sep 2024
Growth in half year ended Sep 2025 is 29.07% vs 28.95% in Sep 2024
Nine Monthly Results Snapshot (Standalone) - Dec'25
YoY Growth in nine months ended Dec 2025 is 19.21% vs 7.34% in Dec 2024
YoY Growth in nine months ended Dec 2025 is 53.59% vs 23.69% in Dec 2024
Annual Results Snapshot (Standalone) - Mar'26
YoY Growth in year ended Mar 2026 is 18.30% vs 9.25% in Mar 2025
YoY Growth in year ended Mar 2026 is 31.30% vs 12.78% in Mar 2025
About SML Mahindra Ltd

Company Coordinates


