
Compare Smruthi Organic with Similar Stocks
Dashboard
Strong ability to service debt as the company has a low Debt to EBITDA ratio of 0.64 times
Poor long term growth as Net Sales has grown by an annual rate of -4.22% and Operating profit at -22.92% over the last 5 years
Flat results in Mar 26
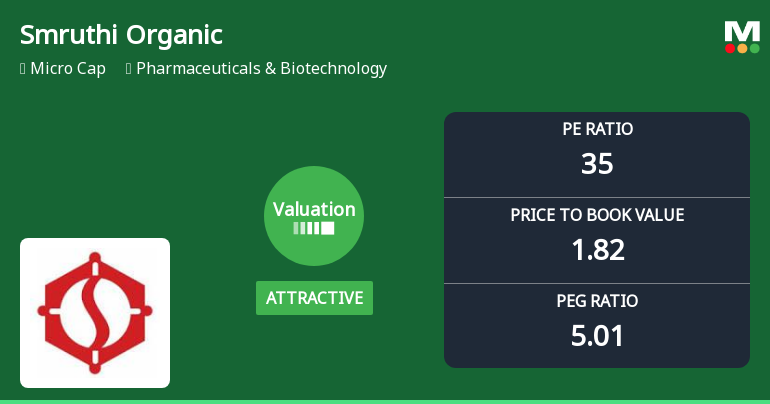
With ROE of 5.2, it has a Attractive valuation with a 1.8 Price to Book Value
Majority shareholders : Promoters
Consistent Underperformance against the benchmark over the last 3 years
Stock DNA
Pharmaceuticals & Biotechnology
INR 134 Cr (Micro Cap)
35.00
33
1.28%
0.08
5.20%
1.82
Total Returns (Price + Dividend) 
Latest dividend: 1.5 per share ex-dividend date: Jun-13-2025
Risk Adjusted Returns v/s
Returns Beta

News
Smruthi Organics Ltd Valuation Shifts Signal Renewed Price Attractiveness
Smruthi Organics Ltd, a micro-cap player in the Pharmaceuticals & Biotechnology sector, has seen its valuation parameters shift favourably, moving from a fair to an attractive rating. Despite a recent dip in share price and sector headwinds, the company’s price-to-earnings (P/E) and price-to-book value (P/BV) ratios now present a compelling case for investors seeking value in a challenging market environment.
Read full news article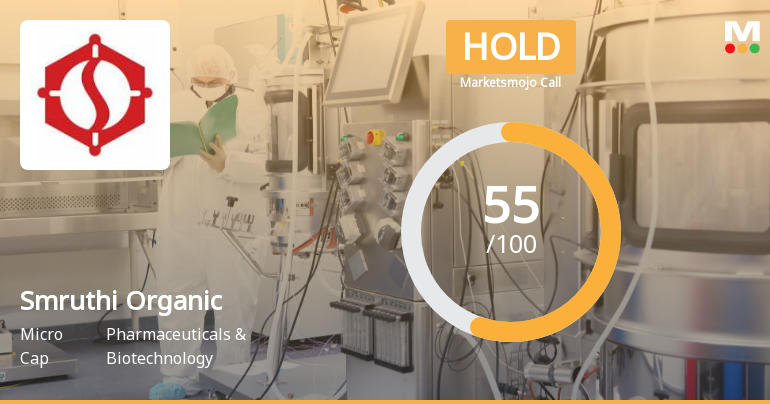
Smruthi Organics Ltd Upgraded to Hold as Financial and Valuation Metrics Improve
Smruthi Organics Ltd has seen its investment rating upgraded from Sell to Hold as of 8 June 2026, reflecting a nuanced shift in the company’s overall outlook. This change is driven by a combination of factors including improved debt servicing ability, fair valuation metrics, and a stabilising financial trend, despite ongoing challenges in long-term growth and market performance.
Read full news article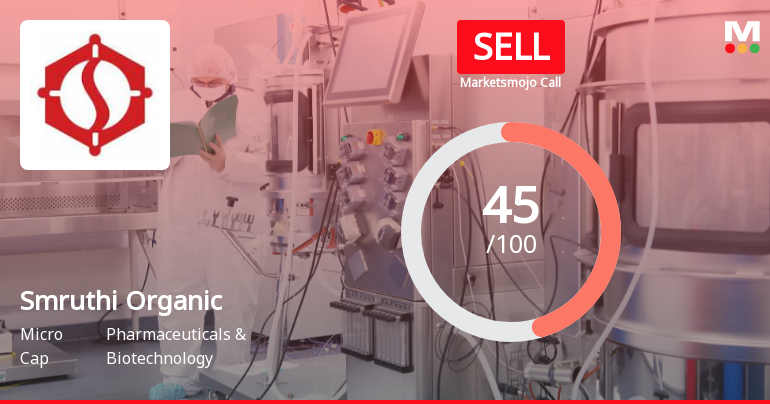
Smruthi Organics Ltd Downgraded to Sell Amidst Weak Financials and Technical Setbacks
Smruthi Organics Ltd, a micro-cap player in the Pharmaceuticals & Biotechnology sector, has seen its investment rating downgraded from Hold to Sell as of 3 June 2026. This revision reflects a combination of deteriorating technical indicators, subdued financial trends, and valuation concerns, signalling caution for investors amid persistent underperformance against benchmarks.
Read full news article Announcements
Announcement under Regulation 30 (LODR)-Newspaper Publication
15-May-2026 | Source : BSENewspaper Advertisement- Financial Results
Intimation Of Record Date For Payment Of Dividend
14-May-2026 | Source : BSEIntimation of Record Date
Compliances-Reg.24(A)-Annual Secretarial Compliance
14-May-2026 | Source : BSEAnnual Secretarial Compliance Report for the financial year ended 31st March 2026
Corporate Actions

No Upcoming Board Meetings

Smruthi Organics Ltd has declared 15% dividend, ex-date: 31 Jul 26

No Splits history available

Smruthi Organics Ltd has announced 2:1 bonus issue, ex-date: 16 Mar 21

No Rights history available
Quality key factors
Valuation key factors
Technicals key factors
 Technical Indicator Scale: Bearish, Mildly Bearish, Sideways, Mildly Bullish, Bullish Turned
 Shareholding Snapshot : Mar 2026
Shareholding Compare (%holding)
Promoters
None
Held by 0 Schemes
Held by 0 FIIs
Eaga Purushotham Malaiah (41.23%)
Smitha Gupta (1.21%)
28.7%
Quarterly Results Snapshot (Standalone) - Mar'26 - QoQ

QoQ Growth in quarter ended Mar 2026 is 30.51% vs -29.46% in Dec 2025
QoQ Growth in quarter ended Mar 2026 is -23.57% vs -32.04% in Dec 2025
Half Yearly Results Snapshot (Standalone) - Sep'25
Growth in half year ended Sep 2025 is -10.71% vs -12.16% in Sep 2024
Growth in half year ended Sep 2025 is 740.00% vs -103.44% in Sep 2024
Nine Monthly Results Snapshot (Standalone) - Dec'25

YoY Growth in nine months ended Dec 2025 is -17.10% vs -0.08% in Dec 2024
YoY Growth in nine months ended Dec 2025 is 77.44% vs -35.75% in Dec 2024
Annual Results Snapshot (Standalone) - Mar'26
YoY Growth in year ended Mar 2026 is -19.08% vs -1.28% in Mar 2025
YoY Growth in year ended Mar 2026 is -3.65% vs -0.84% in Mar 2025
About Smruthi Organics Ltd

Company Coordinates


