
Compare Solarworld Ene. with Similar Stocks
Total Returns (Price + Dividend) 
Solarworld Ene. for the last several years.
Risk Adjusted Returns v/s
Returns Beta

News
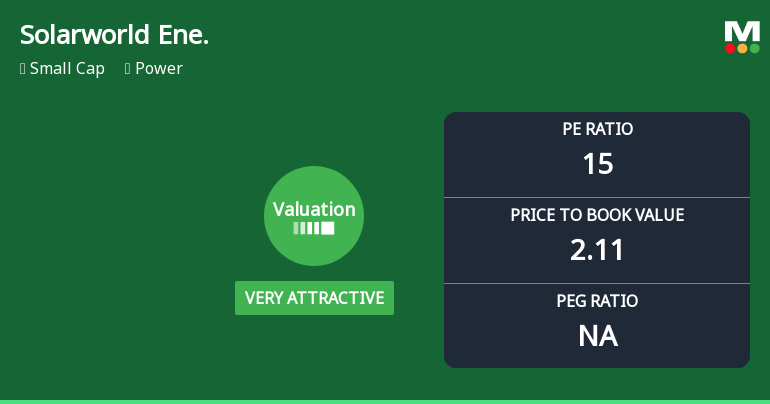
Solarworld Energy Solutions Ltd Valuation Shifts to Very Attractive Amid Sector Comparisons
Solarworld Energy Solutions Ltd has undergone a significant re-rating in its valuation parameters, shifting from an expensive to a very attractive stock within the power sector. This change, coupled with robust return on capital metrics and a favourable peer comparison, positions the company as a compelling opportunity for investors seeking value in the small-cap power segment.
Read full news article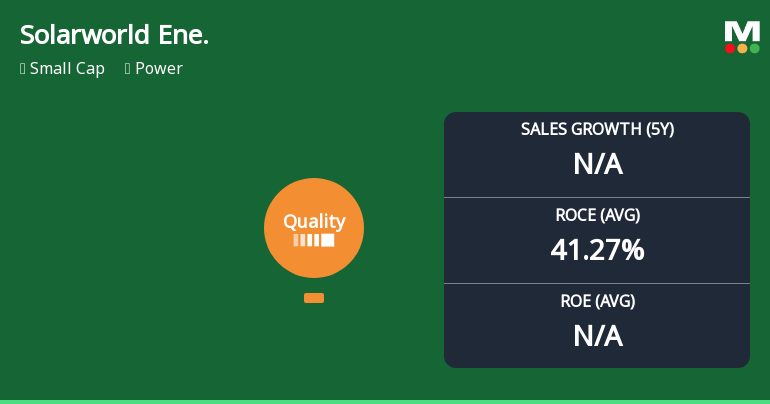
Solarworld Energy Solutions Ltd Upgrades Quality Grade Amidst Mixed Market Performance
Solarworld Energy Solutions Ltd has recently seen its quality grade upgraded from 'Does Not Qualify' to 'Good' by MarketsMOJO, reflecting notable improvements in its business fundamentals. Despite a challenging year-to-date stock performance, the company’s underlying financial metrics, particularly its return on capital employed and debt management, have strengthened, positioning it favourably within the power sector.
Read full news article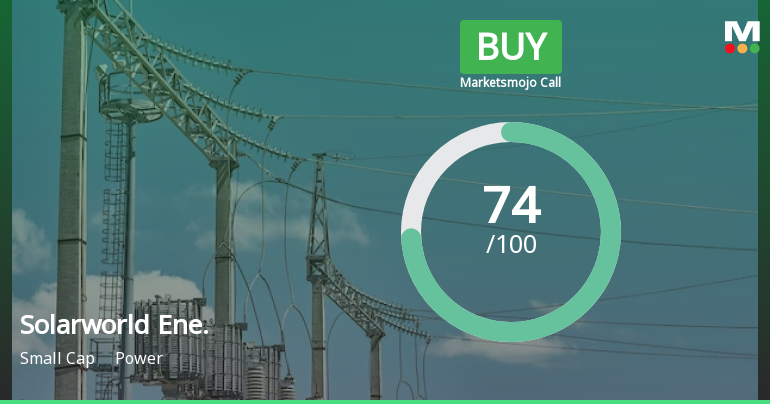
Solarworld Energy Solutions Ltd Upgraded to Buy on Strong Fundamentals and Attractive Valuation
Solarworld Energy Solutions Ltd has been upgraded to a Buy rating with a Mojo Score of 74.0, reflecting significant improvements across quality, valuation, financial trends, and technical parameters. This upgrade marks a notable shift from its previous ungraded status, driven by robust operational metrics, a very attractive valuation profile, and positive financial performance in the power sector.
Read full news article Announcements
Announcement under Regulation 30 (LODR)-Newspaper Publication
27-May-2026 | Source : BSESubmission of copy of Newspaper Advertisement dated May 27 2026
Announcement under Regulation 30 (LODR)-Press Release / Media Release
26-May-2026 | Source : BSEPress Release on the audited (standalone & consolidated) financial results for the quarter and year ended March 31 2026.
Board Meeting Outcome for Audited (Standalone & Consolidated) Financial Results For The Quarter And Year Ended March 31 2026.
26-May-2026 | Source : BSEAudited (Standalone & Consolidated) Financial Results for the quarter and year ended March 31 2026.
Corporate Actions

No Upcoming Board Meetings

No Dividend history available

No Splits history available

No Bonus history available

No Rights history available
Quality key factors
Valuation key factors
Technicals key factors
 Technical Indicator Scale: Bearish, Mildly Bearish, Sideways, Mildly Bullish, Bullish Turned
 Shareholding Snapshot : Mar 2026
Shareholding Compare (%holding)
Promoters
None
Held by 1 Schemes (1.73%)
Held by 8 FIIs (1.24%)
Pioneer Facor It Infradevelopers Private Limited (32.01%)
Valuequest S C A L E Fund (4.83%)
20.11%
Quarterly Results Snapshot (Standalone) - Mar'26 - QoQ

QoQ Growth in quarter ended Mar 2026 is 3.25% vs 290.65% in Dec 2025
QoQ Growth in quarter ended Mar 2026 is -1.34% vs 233.14% in Dec 2025
Half Yearly Results Snapshot (Standalone) - Sep'25
Not Applicable: The company has declared_date for only one period
Not Applicable: The company has declared_date for only one period
Nine Monthly Results Snapshot (Standalone) - Dec'25
Not Applicable: The company has declared_date for only one period
Not Applicable: The company has declared_date for only one period
Annual Results Snapshot (Standalone) - Mar'26
Not Applicable: The company has declared_date for only one period
Not Applicable: The company has declared_date for only one period
About Solarworld Energy Solutions Ltd

Company Coordinates


