
Compare K.P. Energy with Similar Stocks
Dashboard
Strong ability to service debt as the company has a low Debt to EBITDA ratio of 1.38 times
Healthy long term growth as Net Sales has grown by an annual rate of 82.73% and Operating profit at 85.71%
The company has declared Positive results for the last 7 consecutive quarters
With ROCE of 32.8, it has a Very Attractive valuation with a 3 Enterprise value to Capital Employed
Rising Promoter Confidence
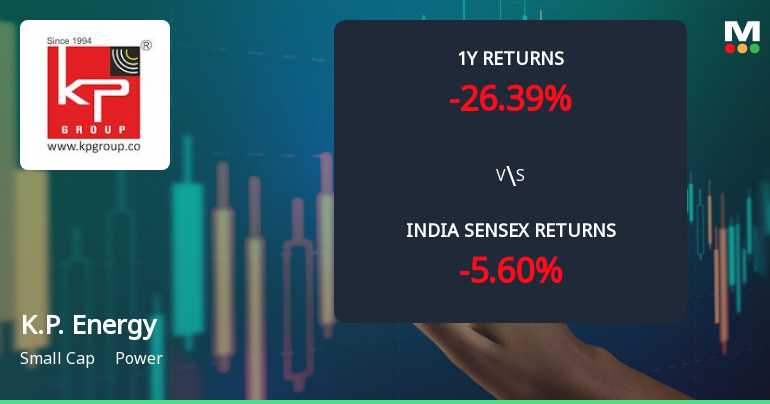
Underperformed the market in the last 1 year
Total Returns (Price + Dividend) 
Latest dividend: 0.2 per share ex-dividend date: Jan-28-2026
Risk Adjusted Returns v/s
Returns Beta

News
K.P. Energy Ltd Technical Momentum Shifts Signal Mild Bullish Outlook
K.P. Energy Ltd, a small-cap player in the power sector, has recently exhibited a notable shift in its technical momentum, moving from a mildly bearish stance to a mildly bullish one. This change is underscored by mixed signals from key technical indicators such as MACD, RSI, moving averages, and Bollinger Bands, suggesting a cautious but improving outlook for investors.
Read full news article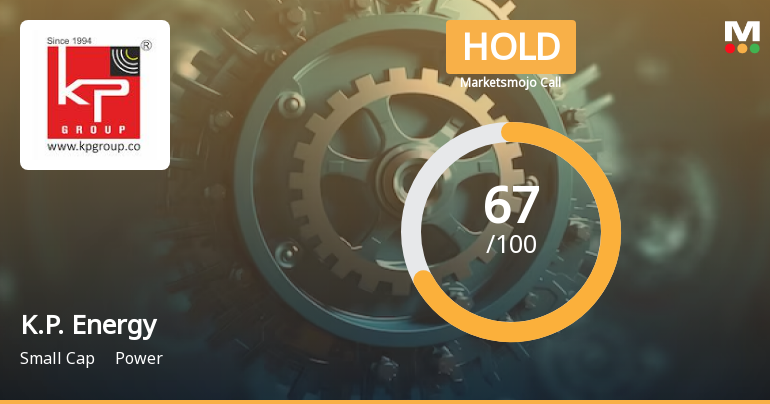
K.P. Energy Ltd is Rated Hold by MarketsMOJO
K.P. Energy Ltd is rated 'Hold' by MarketsMOJO, with this rating last updated on 05 May 2026. However, the analysis and financial metrics discussed here reflect the stock's current position as of 20 June 2026, providing investors with an up-to-date view of the company’s performance and outlook.
Read full news article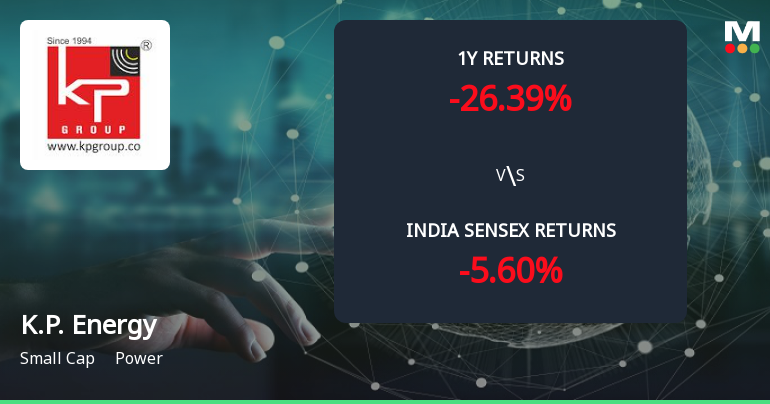
K.P. Energy Ltd Forms Golden Cross Amid Mixed Technical Signals and Modest Price Reaction
The 50-day moving average has crossed above the 200-day moving average for K.P. Energy Ltd, signalling a golden cross on 19 Jun 2026. Yet, the stock declined 1.32% on the day the cross formed, while monthly technical indicators remain bearish. This divergence between the moving averages and other signals calls for a nuanced analysis of the cross’s reliability.
Read full news article Announcements
Announcement under Regulation 30 (LODR)-Analyst / Investor Meet - Intimation
17-Jun-2026 | Source : BSEK.P. Energy Limited informed the Exchange regarding Site Visit by Analyst(s)/ Institutional Investor(s) scheduled to be held on Monday June 22 2026. Disclosure is attached.
Announcement under Regulation 30 (LODR)-Analyst / Investor Meet - Intimation
05-Jun-2026 | Source : BSEK.P. Energy Limited informed the Exchange regarding its participation in Analyst(s)/Institutional Investor(s) Meet scheduled to be held on Friday June 12 2026. Disclosure is attached.
Announcement under Regulation 30 (LODR)-Allotment of ESOP / ESPS
01-Jun-2026 | Source : BSEK.P. Energy Limited informed the exchange regarding allotment of 202258 equity shares of face value of Rs. 5/- each to the eligible employees pursuant to exercise of options under KP Energy - ESOP 2023. Disclosure is Attached herewith.
Corporate Actions

No Upcoming Board Meetings

K.P. Energy Ltd has declared 4% dividend, ex-date: 28 Jan 26

K.P. Energy Ltd has announced 5:10 stock split, ex-date: 10 Mar 23

K.P. Energy Ltd has announced 2:1 bonus issue, ex-date: 12 Feb 24

No Rights history available
Quality key factors
Valuation key factors
Technicals key factors
 Technical Indicator Scale: Bearish, Mildly Bearish, Sideways, Mildly Bullish, Bullish Turned
 Shareholding Snapshot : Mar 2026
Shareholding Compare (%holding)
Non Institution
None
Held by 0 Schemes
Held by 16 FIIs (0.66%)
Farukbhai Gulambhai Patel (45.24%)
Manish Kantilal Haria (1.98%)
42.63%
Quarterly Results Snapshot (Consolidated) - Mar'26 - YoY

YoY Growth in quarter ended Mar 2026 is 57.48% vs 93.57% in Mar 2025
YoY Growth in quarter ended Mar 2026 is 71.85% vs 83.90% in Mar 2025
Half Yearly Results Snapshot (Consolidated) - Sep'25
Growth in half year ended Sep 2025 is 59.66% vs 77.82% in Sep 2024
Growth in half year ended Sep 2025 is 42.22% vs 84.24% in Sep 2024
Nine Monthly Results Snapshot (Consolidated) - Dec'25
YoY Growth in nine months ended Dec 2025 is 60.91% vs 102.36% in Dec 2024
YoY Growth in nine months ended Dec 2025 is 47.71% vs 112.79% in Dec 2024
Annual Results Snapshot (Consolidated) - Mar'26
YoY Growth in year ended Mar 2026 is 59.43% vs 98.55% in Mar 2025
YoY Growth in year ended Mar 2026 is 57.29% vs 97.75% in Mar 2025
About K.P. Energy Ltd

Company Coordinates


