
Compare Sotera Health Co. with Similar Stocks
Dashboard
With a growth in Operating Profit of 27.05%, the company declared Very Positive results in Jun 25
- OPERATING CASH FLOW(Y) Highest at USD 293.98 MM
- NET PROFIT(HY) At USD 58.15 MM has Grown at 50.71%
- RAW MATERIAL COST(Y) Fallen by -7.77% (YoY)
Market Beating performance in long term as well as near term
Stock DNA
Pharmaceuticals & Biotechnology
USD 5,392 Million (Small Cap)
36.00
NA
0.00%
3.36
24.53%
9.80
Total Returns (Price + Dividend) 
Sotera Health Co. for the last several years.
Risk Adjusted Returns v/s
News
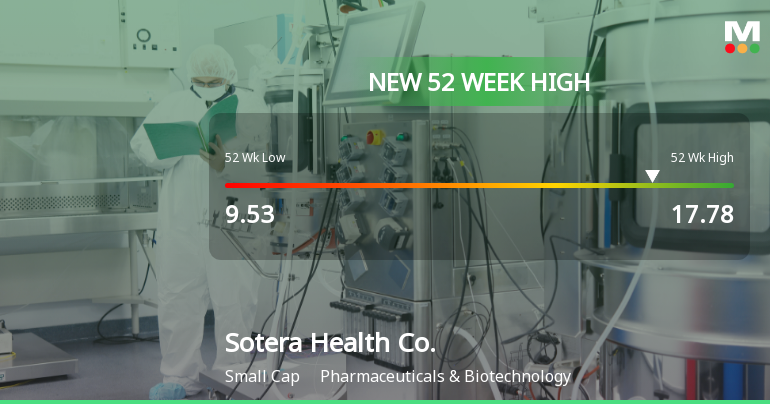
Sotera Health Co. Hits New 52-Week High at $17.78
Sotera Health Co. achieved a new 52-week high of USD 17.78 on November 4, 2025, marking a notable performance in the Pharmaceuticals & Biotechnology sector. The company has seen a 37.6% growth over the past year, with a P/E ratio of 36.00 and a return on equity of 19.00%.
Read full news article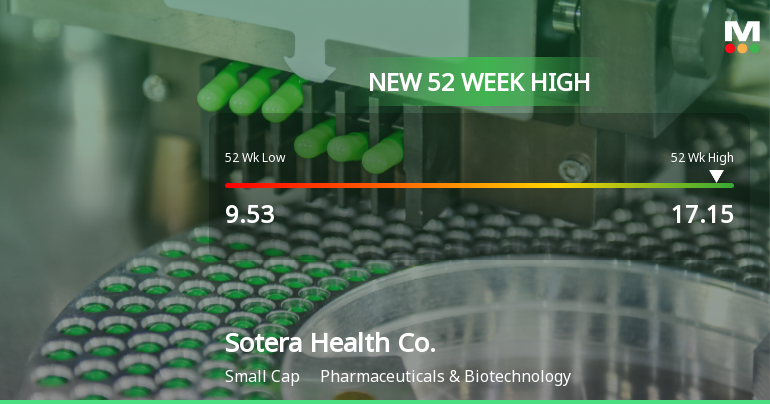
Sotera Health Co. Hits New 52-Week High of $17.15
Sotera Health Co. achieved a new 52-week high of USD 17.15 on October 24, 2025, reflecting strong performance in the Pharmaceuticals & Biotechnology sector. The company has seen a 41.21% growth over the past year and maintains a P/E ratio of 36.00 and a return on equity of 19.00%.
Read full news article Announcements

Corporate Actions
Quality key factors
Valuation key factors
Technicals key factors
 Technical Indicator Scale: Bearish, Mildly Bearish, Sideways, Mildly Bullish, Bullish Turned
 Shareholding Snapshot : Sep 2025
Shareholding Compare (%holding)
Strategic Entities
Held in 53 Schemes (18.82%)
Held by 91 Foreign Institutions (4.62%)
Quarterly Results Snapshot (Consolidated) - Sep'25 - QoQ

QoQ Growth in quarter ended Sep 2025 is 5.78% vs 15.64% in Jun 2025

QoQ Growth in quarter ended Sep 2025 is 505.00% vs 160.15% in Jun 2025
Annual Results Snapshot (Consolidated) - Dec'24
YoY Growth in year ended Dec 2024 is 4.87% vs 4.54% in Dec 2023
YoY Growth in year ended Dec 2024 is -13.31% vs 121.88% in Dec 2023
About Sotera Health Co.

Company Coordinates


