
Compare Southern Infocon with Similar Stocks
Dashboard
Weak Long Term Fundamental Strength with a -1.44% CAGR growth in Operating Profits over the last 5 years
- Company's ability to service its debt is weak with a poor EBIT to Interest (avg) ratio of -0.08
- The company has been able to generate a Return on Equity (avg) of 2.41% signifying low profitability per unit of shareholders funds
Flat results in Mar 26
Risky - Negative EBITDA
Stock DNA
Computers - Software & Consulting
INR 11 Cr (Micro Cap)
NA (Loss Making)
20
0.00%
-0.86
-2.05%
1.91
Total Returns (Price + Dividend) 
Southern Infocon for the last several years.
Risk Adjusted Returns v/s
Returns Beta

News
Are Southern Infoconsultants Ltd latest results good or bad?
Southern Infoconsultants Ltd's latest financial results for Q4 FY26 present a complex picture of operational performance. The company reported a net profit of ₹0.06 crores, which, while positive compared to the previous quarter, reflects a significant decline of 33.33% year-on-year. This indicates ongoing challenges in maintaining profitability despite a sequential revenue growth of 14.94%, bringing net sales to ₹3.00 crores. However, this revenue figure is still down 40.12% compared to the same quarter last year, highlighting persistent instability in the company's revenue generation. The operating margin for the quarter was recorded at 0.67%, a slight improvement from the negative margin in the previous quarter but still considerably lower than the margins seen in earlier periods. This suggests that while there may be some operational recovery, the overall efficiency remains a concern. The company's retu...
Read full news article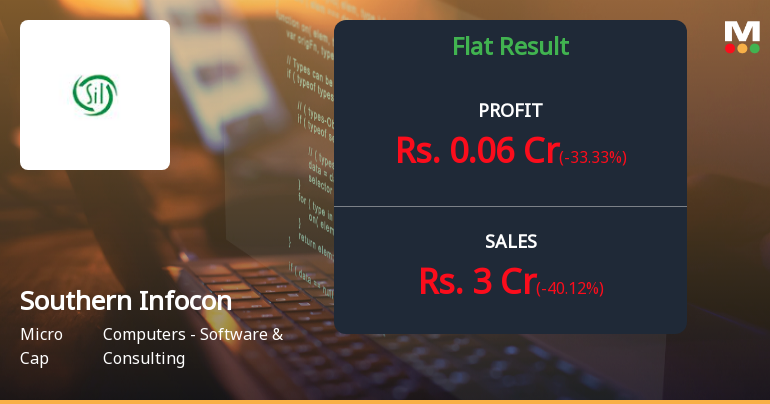
Southern Infoconsultants Q4 FY26: Profitability Returns Amid Revenue Volatility
Southern Infoconsultants Ltd., a micro-cap software consulting firm with a market capitalisation of ₹11.00 crores, reported a consolidated net profit of ₹0.06 crores for Q4 FY26, marking a return to profitability after a loss-making Q3. However, the quarter was characterised by extreme revenue volatility and razor-thin margins, raising concerns about operational sustainability. Trading at ₹22.00 per share, the stock remains trapped in a bearish technical trend, having declined 45.01% from its 52-week high of ₹40.01.
Read full news article Announcements
Announcement under Regulation 30 (LODR)-Newspaper Publication
29-May-2026 | Source : BSEPlease find enclosed
Format of the Annual Disclosure to be made by an entity identified as a LC - Annexure B2
29-May-2026 | Source : BSEFormat of the Annual Disclosure to be made by an entity identified as a Large Corporate.
| Sr. No. | Particulars | Details |
| 1 | Name of Company | Southern Infoconsultants Ltd |
| 2 | CIN NO. | L67120DL1994PLC059994 |
| 3 | Report filed for FY | 2025-2026 |
| Details of the Current block (all figures in Rs crore): | ||
| 4 | 2 - year block period (Specify financial years)* | NA |
| 5 | Incremental borrowing done in FY (T)(a) | 0.00 |
| 6 | Mandatory borrowing to be done through debt securities in FY (T) (b) = (25% of a) | 0.00 |
| 7 | Actual borrowing done through debt securities in FY (T)(c) | 0.00 |
| 8 | Shortfall in the borrowing through debt securities if any for FY (T - 1) carried forward to FY (T) (d) | NA |
| 8 | Quantum of (d) which has been met from (c)(e)* | NA |
| 9 | Shortfall if any in the mandatory borrowing through debt securities for FY (T) { after adjusting for any shortfall in borrowing for FY(T - 1) which was carried forward to FY(T)}(f) = (b) - [(c) - (e)]{ If the calculated value is zero or negative write nil}* | NA |
| Details of penalty to be paid if any in respect to previous block (all figures in Rs crore): | |
| 2 - year Block period (Specify financial years) | NA |
| Amount of fine to be paid for the block if applicable Fine = 0.2% of {(d) - (e)}# | 0.00 |
| Name of the Company Secretary :- | KRITI BAREJA |
| Designation :- | COMPANY SECRETARY AND COMPLIANCE OFFICER |
| Name of the Chief Financial Officer :- | Deepika |
| Designation : - | CFO |
Date: 29/05/2026
Announcement under Regulation 30 (LODR)-Code of Conduct under SEBI (PIT) Regulations 2015
28-May-2026 | Source : BSEPlease find enclosed
Corporate Actions

No Upcoming Board Meetings

No Dividend history available

No Splits history available

No Bonus history available

No Rights history available
Quality key factors
Valuation key factors
Technicals key factors
 Technical Indicator Scale: Bearish, Mildly Bearish, Sideways, Mildly Bullish, Bullish Turned
 Shareholding Snapshot : Mar 2026
Shareholding Compare (%holding)
Promoters
None
Held by 0 Schemes
Held by 0 FIIs
Disha Investment Centre Pvt Ltd (29.56%)
Poonam Sharma (2.21%)
21.98%
Quarterly Results Snapshot (Consolidated) - Mar'26 - YoY

YoY Growth in quarter ended Mar 2026 is -40.12% vs -40.57% in Mar 2025
YoY Growth in quarter ended Mar 2026 is -33.33% vs -55.00% in Mar 2025
Half Yearly Results Snapshot (Consolidated) - Sep'25
Growth in half year ended Sep 2025 is 162.37% vs -70.15% in Sep 2024

Growth in half year ended Sep 2025 is -212.50% vs 33.33% in Sep 2024
Nine Monthly Results Snapshot (Consolidated) - Dec'25
YoY Growth in nine months ended Dec 2025 is -4.23% vs -20.63% in Dec 2024
YoY Growth in nine months ended Dec 2025 is -200.00% vs 125.00% in Dec 2024
Annual Results Snapshot (Consolidated) - Mar'26
YoY Growth in year ended Mar 2026 is -17.93% vs -29.69% in Mar 2025
YoY Growth in year ended Mar 2026 is -146.15% vs -7.14% in Mar 2025
About Southern Infoconsultants Ltd

Company Coordinates


