Speciality Rest.

  • Market Cap: Micro Cap
  • Industry: Leisure Services
  • ISIN: INE247M01014
  • NSEID: SPECIALITY
  • BSEID: 534425
INR
119.25
0.8 (0.68%)
BSENSE

Dec 05

BSE+NSE Vol: 90.45 k

  • Price Points
  • Score
  • Mojo Parameters
  • Total Return
  • News and Corporate Actions
  • Key factors
  • Shareholding
  • Financials
  • CompanyCV
stock-summaryPrice Point
High/Low

1Day

52 Week

Valuation
Technical
Day's Volume

CASH

90.45 k (28.80%) Volume

Shareholding (Sep 2025)

FII

0.47%

Held by 5 FIIs

DII

1.76%

Held by 0 DIIs

Promoter

50.20%

Who are the top shareholders of the Speciality Rest.?

06-Jun-2025

The top shareholders of Speciality Rest. include promoter Anjan Snehmoy Chatterjee with 25.28%, followed by public shareholder Deepak Bhagnani at 6.97%. Individual investors hold 38.96%, while foreign institutional investors hold 0.39%, with no pledged promoter holdings or mutual fund investments.

The top shareholders of Speciality Rest. include the promoters, who hold the majority of the shares. The promoter with the highest holding is Anjan Snehmoy Chatterjee, owning 25.28% of the company. In terms of public shareholders, Deepak Bhagnani is the largest, holding 6.97%. Additionally, individual investors collectively hold 38.96% of the shares, while foreign institutional investors (FIIs) hold 0.39% through five different FIIs. There are no pledged promoter holdings, and mutual funds do not currently hold any shares in the company.

Read More

Who are in the management team of Speciality Rest.?

06-Jun-2025

As of March 2021, the management team of Speciality Rest. includes Anjan Chatterjee (Chairman & Managing Director), Suchhanda Chatterjee (Whole-time Director), Indranil Ananda Chatterjee (Deputy Managing Director), and several independent directors, including Dushyant Mehta, ULLAL RAVINDRA BHAT, Rakesh Pandey, and Anita Bandyopadhyay. The team also features Avinash Kinhikar as Company Secretary and Avik Chatterjee as a Whole-time Director.

As of March 2021, the management team of Speciality Rest. includes the following individuals:<BR><BR>1. Anjan Chatterjee - Chairman & Managing Director<BR>2. Suchhanda Chatterjee - Whole-time Director<BR>3. Indranil Ananda Chatterjee - Deputy Managing Director<BR>4. Dushyant Rajnikant Mehta - Independent Director<BR>5. Avinash Kinhikar - Company Secretary<BR>6. ULLAL RAVINDRA BHAT - Independent Director<BR>7. Rakesh Pandey - Independent Director<BR>8. Avik Chatterjee - Whole-time Director<BR>9. Anita Bandyopadhyay - Independent Director<BR><BR>This team comprises a mix of directors and executives, each with specific roles within the company.

Read More

What does Speciality Rest. do?

06-Jun-2025

Speciality Restaurants Ltd operates a large chain of fine dining restaurants and reported net sales of 103 Cr and a net profit of 2 Cr for March 2025, with a market cap of Rs 618 Cr. The company has a P/E ratio of 28.00 and a dividend yield of 0.78%.

Overview: <BR>Speciality Restaurants Ltd operates one of the largest chains of fine dining restaurants, primarily in the leisure services industry, and is categorized as a micro-cap company.<BR><BR>History: <BR>Incorporated in 1999, Speciality Restaurants Ltd has established itself in the fine dining sector, with its latest reported quarterly results showing net sales and net profit for March 2025.<BR><BR>Financial Snapshot: <BR>Net Sales: 103 Cr (Quarterly Results - Mar 2025) <BR>Net Profit: 2 Cr (Quarterly Results - Mar 2025) <BR>Market Cap: Rs 618 Cr (Micro Cap)<BR><BR>Key Metrics: <BR>P/E: 28.00 <BR>Industry P/E: 82 <BR>Dividend Yield: 0.78% <BR>Debt Equity: -0.07 <BR>Return on Equity: 6.64% <BR>Price to Book: 1.88<BR><BR>Contact Details: <BR>Address: Uniworth House, 3A Gurusaday Road Kolkata West Bengal : 700019 <BR>Tel: 91-33-22837964/65/66 <BR>Email: corporate@speciality.co.in <BR>Website: http://www.speciality.co.in

Read More

Has Speciality Rest. declared dividend?

06-Jun-2025

Yes, Speciality Restaurants Ltd has declared a 10% dividend, amounting to 1 per share, with an ex-date of September 13, 2024. While recent total returns have been negative, the company has shown significant growth over the last 4 to 5 years.

Speciality Restaurants Ltd has declared a 10% dividend.<BR><BR>Dividend Details:<BR>- Percentage announced: 10%<BR>- Amount per share: 1 per share<BR>- Ex-date: 13 Sep 24<BR><BR>Dividend Yield: 0.78%.<BR><BR>Total Returns by Period:<BR>Over the last 6 months, the price return was -17.22%, with no dividend return, resulting in a total return of -17.22%.<BR><BR>In the 1-year period, the price return was -25.43%, with a dividend return of 0.59%, leading to a total return of -24.84%.<BR><BR>For the 2-year period, the price return was -45.26%, with a dividend return of 1.49%, resulting in a total return of -43.77%.<BR><BR>In the 3-year period, the price return was 1.23%, with a dividend return of 3.19%, leading to a total return of 4.42%.<BR><BR>Over the last 4 years, the price return was 127.26%, with a dividend return of 5.77%, resulting in a total return of 133.03%.<BR><BR>In the 5-year period, the price return was 231.55%, with a dividend return of 11.29%, leading to a total return of 242.84%.<BR><BR>Overall, while Speciality Restaurants Ltd has declared a dividend, the total returns over the shorter periods have been negative, indicating challenges in performance. However, there has been significant positive growth in the longer term, particularly over the last 4 to 5 years.

Read More

Who are the peers of the Speciality Rest.?

03-Jun-2025

Peers of Speciality Rest. include Jubilant Food, Devyani Intl., Westlife Food, Sapphire Foods, and others. Speciality Rest. has Good growth and Average management risk, with a 1-year return of -24.22%.

Peers: The peers of Speciality Rest. are Jubilant Food, Devyani Intl., Westlife Food, Sapphire Foods, Restaurant Brand, Nicco Parks, Kaya Ltd, Gourmet Gateway, Vikram Kamats, and Pecos Hotels.<BR><BR>Quality Snapshot: Excellent management risk is observed at Nicco Parks, while Good management risk is found at Jubilant Food, and Average management risk is present at Devyani Intl., Westlife Food, Sapphire Foods, Vikram Kamats, and Speciality Rest. Below Average management risk is noted at Restaurant Brand, Kaya Ltd, Gourmet Gateway, and the rest. Growth is rated as Good for Speciality Rest., while Average growth is seen at Gourmet Gateway, and Below Average growth is found at Jubilant Food, Devyani Intl., Westlife Food, Sapphire Foods, Restaurant Brand, Nicco Parks, Kaya Ltd, Vikram Kamats, and the rest. Capital Structure is Excellent at Nicco Parks and Gourmet Gateway, Average at Jubilant Food, Speciality Rest., and Pecos Hotels, and Below Average at Devyani Intl., Westlife Food, Sapphire Foods, Restaurant Brand, Kaya Ltd, and Vikram Kamats.<BR><BR>Return Snapshot: The peer with the highest 1-year return is Pecos Hotels at 95.16%, while the lowest is Gourmet Gateway at -55.86%. Speciality Rest. has a 1-year return of -24.22%, which is significantly lower than both extremes. Additionally, the six-month return is negative for Westlife Food, Sapphire Foods, Restaurant Brand, Nicco Parks, Gourmet Gateway, and Vikram Kamats.

Read More

How big is Speciality Rest.?

24-Jul-2025

As of 24th July, Speciality Restaurants Ltd has a market capitalization of 664.00 Cr, with recent net sales of 436.25 Cr and a net profit of 21.72 Cr. The company's shareholder's funds are 307.22 Cr, and total assets amount to 476.09 Cr.

As of 24th July, Speciality Restaurants Ltd has a market capitalization of 664.00 Cr, categorizing it as a Micro Cap company.<BR><BR>In the latest four quarters, the company reported Net Sales of 436.25 Cr and a Net Profit of 21.72 Cr.<BR><BR>The latest annual period for the balance sheet is March 2024, with Shareholder's Funds amounting to 307.22 Cr and Total Assets of 476.09 Cr.

Read More

When is the next results date for Speciality Rest.?

30-Jul-2025

The next results date for Speciality Rest. is 05 August 2025.

The next results date for Speciality Rest. is scheduled for 05 August 2025.

Read More

Are Speciality Rest. latest results good or bad?

06-Aug-2025

Speciality Restaurants' latest results are concerning, with a 26.8% decline in Profit After Tax despite a 5.49% increase in net sales. Analysts have rated the stock as a 'Strong Sell' due to reliance on non-operating income and overall negative financial trends.

The latest results for Speciality Restaurants indicate a challenging financial performance. The company reported a Profit After Tax (PAT) of Rs 5.40 crore for the quarter ending June 2025, which represents a significant decline of 26.8% compared to the same quarter last year. Additionally, while net sales grew by 5.49%, this is a decrease from the previous year's growth rate of 8.94%.<BR><BR>On a more positive note, the Debtors Turnover Ratio has improved to 79.32 times, the highest in the last five half-yearly periods, suggesting that the company is managing its receivables more effectively. However, the heavy reliance on non-operating income, which makes up 88.85% of the Profit Before Tax, raises concerns about the sustainability of its income sources.<BR><BR>Overall, the financial results reflect a negative trend, and the stock has been rated as a 'Strong Sell' by analysts, indicating a lack of confidence in the company's current financial health.

Read More

Is Speciality Rest. overvalued or undervalued?

24-Nov-2025

As of November 21, 2025, Speciality Restaurant is fairly valued with a PE ratio of 28.63, an EV to EBITDA ratio of 7.51, and a Price to Book Value of 1.86, making it more reasonably priced compared to peers like Page Industries and Jubilant Food, despite a year-to-date stock performance lagging behind the Sensex.

As of 21 November 2025, the valuation grade for Speciality Restaurant has moved from expensive to fair. The company is currently fairly valued based on its financial ratios. The PE ratio stands at 28.63, the EV to EBITDA ratio is 7.51, and the Price to Book Value is 1.86. <BR><BR>When compared to its peers, Speciality Restaurant's valuation appears more reasonable; for instance, Page Industries is very expensive with a PE of 56.81, while Jubilant Food is also expensive with a PE of 121.85. Despite recent stock performance lagging behind the Sensex, particularly with a year-to-date return of -8.74% compared to the Sensex's 9.08%, the company's current valuation metrics suggest it is positioned fairly within its industry.

Read More

How has been the historical performance of Speciality Rest.?

02-Dec-2025

Speciality Rest. has shown significant growth in net sales and total assets from Mar'21 to Mar'25, but profitability has declined, with profit after tax dropping from 96.72 Cr in Mar'23 to 21.97 Cr in Mar'25. Operating profit increased slightly, but overall financial performance reflects challenges in maintaining profitability despite rising revenues.

Answer:<BR>The historical performance of Speciality Rest. shows a fluctuating trend in key financial metrics over the years.<BR><BR>Breakdown:<BR>Speciality Rest. has experienced significant growth in net sales, increasing from 150.14 Cr in Mar'21 to 436.25 Cr in Mar'25. The total operating income followed a similar trend, reaching 436.25 Cr in Mar'25, up from 252.93 Cr in Mar'22. However, the total expenditure also rose, amounting to 363.65 Cr in Mar'25, which led to an operating profit of 72.60 Cr, slightly up from 70.10 Cr in Mar'24 but down from 84.88 Cr in Mar'23. Profit before tax peaked at 63.37 Cr in Mar'23 but decreased to 28.61 Cr in Mar'25, while profit after tax showed a decline from 96.72 Cr in Mar'23 to 21.97 Cr in Mar'25. The company's total assets increased from 348.87 Cr in Mar'20 to 513.82 Cr in Mar'25, with total liabilities also rising to 513.82 Cr in Mar'25. Cash flow from operating activities improved to 74.00 Cr in Mar'25, although the net cash outflow was recorded at -2.00 Cr. Overall, while Speciality Rest. has shown growth in sales and assets, profitability has faced challenges in recent years.

Read More

Should I buy, sell or hold Speciality Rest.?

03-Dec-2025

Why is Speciality Rest. falling/rising?

04-Dec-2025

As of 04-Dec, Speciality Restaurants Ltd's stock price is at Rs 118.45, down 3.54%, and has significantly underperformed the Sensex with a year-to-date decline of 15.87%. The stock is trading below all key moving averages and is near its 52-week low, indicating a bearish trend and decreased investor interest.

As of 04-Dec, Speciality Restaurants Ltd's stock price is falling, currently at Rs 118.45, which reflects a decrease of Rs 4.35 or 3.54%. The stock has underperformed significantly compared to the benchmark Sensex, with a one-week decline of 8.53% while the Sensex only fell by 0.53%. Over the past month, the stock has dropped 13.54%, contrasting sharply with the Sensex's gain of 2.16%. Year-to-date, the stock is down 15.87%, while the Sensex has increased by 9.12%. <BR><BR>Additionally, the stock is trading below all key moving averages, including the 5-day, 20-day, 50-day, 100-day, and 200-day averages, indicating a bearish trend. The stock is also close to its 52-week low, just 3.5% above the low of Rs 114.3. Investor participation has decreased significantly, with delivery volume dropping by 73.85% compared to the 5-day average, suggesting a lack of interest among investors. All these factors contribute to the current decline in the stock price of Speciality Restaurants Ltd.

Read More

Is Speciality Rest. technically bullish or bearish?

05-Dec-2025

As of December 4, 2025, the technical trend is mildly bearish, supported by bearish MACD and Bollinger Bands on weekly and monthly charts, despite some mildly bullish daily moving averages and a weakly bullish KST, indicating overall bearish sentiment reinforced by underperformance against the Sensex.

As of 4 December 2025, the technical trend has changed from sideways to mildly bearish. The current technical stance is bearish, with key indicators supporting this view. Both the weekly and monthly MACD are bearish, and Bollinger Bands also reflect a bearish trend in both time frames. The Dow Theory indicates a mildly bearish outlook on both weekly and monthly bases. Although daily moving averages show a mildly bullish signal, the overall strength of the bearish indicators outweighs this. The KST is bullish on a weekly basis but only mildly bullish monthly, which does not provide sufficient strength to counter the bearish signals. The stock has underperformed significantly compared to the Sensex over multiple time frames, further reinforcing the bearish sentiment.

Read More
iScoreScore
Click here to find our call on this stock
Strong Sell
Sell
Hold
Buy
Strong Buy

MarketsMojo — Loved in India, Now Global

The power of Mojo is now in 29 countries. Explore global equities with the same cutting-edge features you love.

Dashboard
1

Flat results in Sep 25

  • ROCE(HY) Lowest at 8.85%
  • NON-OPERATING INCOME(Q) is 64.08 % of Profit Before Tax (PBT)
2

Despite the size of the company, domestic mutual funds hold only 0% of the company

3

Consistent Underperformance against the benchmark over the last 3 years

stock-summaryMojo Parameters
Mojo Parameters
Loading Valuation Snapshot...
Stock DNA
stock-summary
Industry

Leisure Services

stock-summary
Market cap

INR 572 Cr (Micro Cap)

stock-summary
P/E

27.00

stock-summary
Industry P/E

55

stock-summary
Dividend Yield

0.84%

stock-summary
Debt Equity

-0.09

stock-summary
Return on Equity

6.48%

stock-summary
Price to Book

1.71

Revenue and Profits:
Net Sales:
116 Cr
(Quarterly Results - Sep 2025)
Net Profit:
5 Cr
stock-summaryTotal Returns
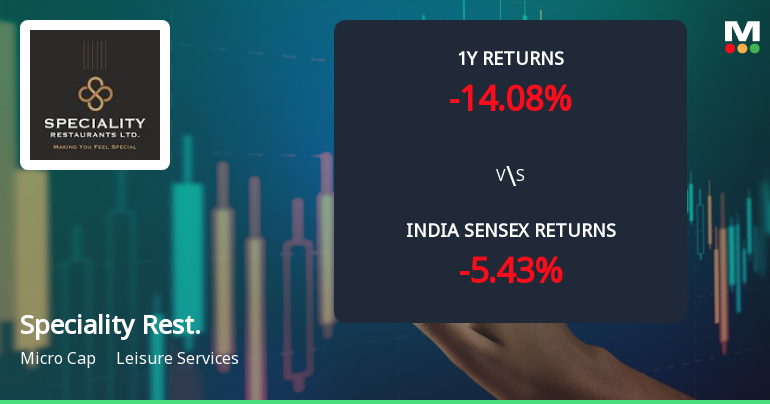
Total Returns (Price + Dividend) stock-summary
Dividend Yield (0.84%)
TimePeriod
Price Return
Dividend Return
Total Return
3 Months
-3.05%
0%
-3.05%
6 Months
-6.54%
0.77%
-5.77%
1 Year
-22.54%
0.65%
-21.89%
2 Years
-36.7%
1.09%
-35.61%
3 Years
-41.9%
2.04%
-39.86%
4 Years
24.02%
4.93%
28.95%
5 Years
176.68%
9.17%
185.85%

Latest dividend: 1 per share ex-dividend date: Aug-28-2025

Risk Adjusted Returns v/s stock-summary
Returns Beta
Icon
Beta has not been calculated since enough price history is not available
stock-summaryNews & Corporate Actions
News

Is Speciality Rest. technically bullish or bearish?

Recent Price Action and Trend Overview

As of the latest trading session, Speciality Rest. closed at ₹118.45, down from the previous close of ₹122.80. The stock’s intraday range was between ₹118.00 and ₹121.50, hovering close to its 52-week low of ₹114.30, while still significantly below its 52-week high of ₹166.00. This price action reflects a notable downward pressure in recent weeks.

The technical trend change from sideways to mildly bearish signals a shift in market sentiment. After a period of consolidation, the stock appears to be losing upward momentum, suggesting caution for investors eyeing near-term gains.

Technical Indicators: Mixed Signals but Leaning Bearish

Examining the key technical indicators provides a nuanced picture. Th...

Read More
Announcements stock-summary

Announcement under Regulation 30 (LODR)-Newspaper Publication

02-Dec-2025 | Source : BSE

Newspaper Advertisement regarding special window for re-lodgement of transfer requests of physical shares and 100 days Campaign named Saksham Niveshak by Investor Education and Protection Fund Authority Ministry of Corporate Affairs.

Disclosure In Terms Of Regulation 30 Of SEBI (Listing Obligations And Disclosure Requirements) Regulations 2015

29-Nov-2025 | Source : BSE

The Company has entered into a Franchise Agreement with Asia Kitchen by Mainland China LLC.

Disclosure In Terms Of Regulation 30 Of SEBI (Listing Obligations And Disclosure Requirements) Regulations 2015 - Update On Development Of Leasehold Land At Bhubaneshwar Orissa

26-Nov-2025 | Source : BSE

Update on Development of leasehold land at Bhubaneshwar Orissa.

Corporate Actions stock-summary
stock-summary
BOARD MEETING

No Upcoming Board Meetings

stock-summary
DIVIDEND

Speciality Restaurants Ltd has declared 10% dividend, ex-date: 28 Aug 25

stock-summary
SPLITS

No Splits history available

stock-summary
BONUS

No Bonus history available

stock-summary
RIGHTS

No Rights history available

stock-summaryKey Factors
Quality key factors stock-summary
Factor
Value
Sales Growth (5y)
16.71%
EBIT Growth (5y)
22.61%
EBIT to Interest (avg)
1.82
Debt to EBITDA (avg)
Negative Net Debt
Net Debt to Equity (avg)
-0.09
Sales to Capital Employed (avg)
0.88
Tax Ratio
23.75%
Dividend Payout Ratio
16.03%
Pledged Shares
0
Institutional Holding
2.23%
ROCE (avg)
8.60%
ROE (avg)
13.60%
Valuation key factors
Factor
Value
P/E Ratio
27
Industry P/E
55
Price to Book Value
1.72
EV to EBIT
21.21
EV to EBITDA
6.94
EV to Capital Employed
1.79
EV to Sales
1.20
PEG Ratio
NA
Dividend Yield
0.84%
ROCE (Latest)
8.46%
ROE (Latest)
6.48%
Technicals key factors
Indicator
Weekly
Monthly
MACD
Bearish
Bearish
RSI
No Signal
No Signal
Bollinger Bands
Bearish
Bearish
Moving Averages
Mildly Bullish (Daily)
KST
Bullish
Mildly Bullish
Dow Theory
Mildly Bearish
Mildly Bearish
OBV
Mildly Bearish
Mildly Bearish
stock-summary Technical Indicator Scale: Bearish, Mildly Bearish, Sideways, Mildly Bullish, Bullish  Turned 
stock-summaryShareholding
Shareholding Snapshot : Sep 2025stock-summary
Shareholding Compare (%holding) stock-summary
Majority shareholders

Promoters

Pledged Promoter Holdings

None

Mutual Funds

Held by 0 Schemes

FIIs

Held by 5 FIIs (0.47%)

Promoter with highest holding

Anjan Snehamoy Chatterjee (25.39%)

Highest Public shareholder

Deepak Bhagnani (6.97%)

Individual Investors Holdings

38.95%

stock-summaryFinancial
[
  {
    "link": "quarterly",
    "btn_text": "All Quarterly Results",
    "header": "Quarterly Results Snapshot (Consolidated) - Sep'25 - YoY",
    "rhs": [
      {
        "prefix": "Net Sales ",
        "suffix": "YoY Growth in quarter ended Sep 2025 is 11.55% vs 6.64% in Sep 2024",
        "dir": 1
      },
      {
        "prefix": "Consolidated Net Profit ",
        "suffix": "YoY Growth in quarter ended Sep 2025 is 70.74% vs -53.12% in Sep 2024",
        "dir": 1
      }
    ],
    "table": {
      "header": [
        "Sep'25",
        "Sep'24",
        "Change(%)"
      ],
      "body": [
        {
          "field": "Net Sales",
          "val1": "116.44",
          "val2": "104.38",
          "chgp": "11.55%",
          "chgp_class": "positive"
        },
        {
          "field": "Operating Profit (PBDIT) excl Other Income",
          "val1": "19.28",
          "val2": "15.31",
          "chgp": "25.93%",
          "chgp_class": "positive"
        },
        {
          "field": "Interest",
          "val1": "3.65",
          "val2": "3.36",
          "chgp": "8.63%",
          "chgp_class": "negative"
        },
        {
          "field": "Exceptional Items",
          "val1": "0.00",
          "val2": "0.00",
          "chgp": "",
          "chgp_class": "neutral"
        },
        {
          "field": "Consolidate Net Profit",
          "val1": "4.61",
          "val2": "2.70",
          "chgp": "70.74%",
          "chgp_class": "positive"
        },
        {
          "field": "Operating Profit Margin (Excl OI)",
          "val1": "16.56%",
          "val2": "14.67%",
          "chgp": "1.89%",
          "chgp_class": "positive"
        }
      ]
    }
  },
  {
    "link": "half-yearly",
    "btn_text": "All Half Yearly Results",
    "header": "Half Yearly Results Snapshot (Consolidated) - Sep'25",
    "rhs": [
      {
        "prefix": "Net Sales ",
        "suffix": " Growth in half year ended Sep 2025 is 8.54% vs 7.77% in Sep 2024",
        "dir": 1
      },
      {
        "prefix": "Consolidated Net Profit ",
        "suffix": " Growth in half year ended Sep 2025 is -0.69% vs -19.17% in Sep 2024",
        "dir": 1
      }
    ],
    "table": {
      "header": [
        "Sep'25",
        "Sep'24",
        "Change(%)"
      ],
      "body": [
        {
          "field": "Net Sales",
          "val1": "225.21",
          "val2": "207.49",
          "chgp": "8.54%",
          "chgp_class": "positive"
        },
        {
          "field": "Operating Profit (PBDIT) excl Other Income",
          "val1": "37.14",
          "val2": "31.25",
          "chgp": "18.85%",
          "chgp_class": "positive"
        },
        {
          "field": "Interest",
          "val1": "7.39",
          "val2": "6.89",
          "chgp": "7.26%",
          "chgp_class": "negative"
        },
        {
          "field": "Exceptional Items",
          "val1": "0.00",
          "val2": "0.00",
          "chgp": "",
          "chgp_class": "neutral"
        },
        {
          "field": "Consolidate Net Profit",
          "val1": "10.01",
          "val2": "10.08",
          "chgp": "-0.69%",
          "chgp_class": "negative"
        },
        {
          "field": "Operating Profit Margin (Excl OI)",
          "val1": "16.49%",
          "val2": "15.06%",
          "chgp": "1.43%",
          "chgp_class": "positive"
        }
      ]
    }
  },
  {
    "link": "nine-monthly",
    "btn_text": "All Nine Monthly Results",
    "header": "Nine Monthly Results Snapshot (Consolidated) - Dec'24",
    "rhs": [
      {
        "prefix": "Net Sales ",
        "suffix": "YoY Growth in nine months ended Dec 2024 is 8.02% vs 7.32% in Dec 2023",
        "dir": 1
      },
      {
        "prefix": "Consolidated Net Profit ",
        "suffix": "YoY Growth in nine months ended Dec 2024 is -26.50% vs -36.60% in Dec 2023",
        "dir": 1
      }
    ],
    "table": {
      "header": [
        "Dec'24",
        "Dec'23",
        "Change(%)"
      ],
      "body": [
        {
          "field": "Net Sales",
          "val1": "333.24",
          "val2": "308.51",
          "chgp": "8.02%",
          "chgp_class": "positive"
        },
        {
          "field": "Operating Profit (PBDIT) excl Other Income",
          "val1": "57.36",
          "val2": "56.20",
          "chgp": "2.06%",
          "chgp_class": "positive"
        },
        {
          "field": "Interest",
          "val1": "10.59",
          "val2": "11.20",
          "chgp": "-5.45%",
          "chgp_class": "positive"
        },
        {
          "field": "Exceptional Items",
          "val1": "0.00",
          "val2": "0.00",
          "chgp": "",
          "chgp_class": "neutral"
        },
        {
          "field": "Consolidate Net Profit",
          "val1": "19.33",
          "val2": "26.30",
          "chgp": "-26.50%",
          "chgp_class": "negative"
        },
        {
          "field": "Operating Profit Margin (Excl OI)",
          "val1": "17.21%",
          "val2": "18.22%",
          "chgp": "-1.01%",
          "chgp_class": "negative"
        }
      ]
    }
  },
  {
    "link": "annual",
    "btn_text": "All Annual Results",
    "header": "Annual Results Snapshot (Consolidated) - Mar'25",
    "rhs": [
      {
        "prefix": "Net Sales ",
        "suffix": "YoY Growth in year ended Mar 2025 is 7.80% vs 7.93% in Mar 2024",
        "dir": -1
      },
      {
        "prefix": "Consolidated Net Profit ",
        "suffix": "YoY Growth in year ended Mar 2025 is -26.10% vs -69.64% in Mar 2024",
        "dir": 1
      }
    ],
    "table": {
      "header": [
        "Mar'25",
        "Mar'24",
        "Change(%)"
      ],
      "body": [
        {
          "field": "Net Sales",
          "val1": "436.25",
          "val2": "404.70",
          "chgp": "7.80%",
          "chgp_class": "positive"
        },
        {
          "field": "Operating Profit (PBDIT) excl Other Income",
          "val1": "72.60",
          "val2": "70.10",
          "chgp": "3.57%",
          "chgp_class": "positive"
        },
        {
          "field": "Interest",
          "val1": "14.23",
          "val2": "14.60",
          "chgp": "-2.53%",
          "chgp_class": "positive"
        },
        {
          "field": "Exceptional Items",
          "val1": "0.00",
          "val2": "0.00",
          "chgp": "",
          "chgp_class": "neutral"
        },
        {
          "field": "Consolidate Net Profit",
          "val1": "21.72",
          "val2": "29.39",
          "chgp": "-26.10%",
          "chgp_class": "negative"
        },
        {
          "field": "Operating Profit Margin (Excl OI)",
          "val1": "16.64%",
          "val2": "17.32%",
          "chgp": "-0.68%",
          "chgp_class": "negative"
        }
      ]
    }
  }
]
Quarterly Results Snapshot (Consolidated) - Sep'25 - YoYstock-summary
Sep'25
Sep'24
Change(%)
Net Sales
116.44
104.38
11.55%
Operating Profit (PBDIT) excl Other Income
19.28
15.31
25.93%
Interest
3.65
3.36
8.63%
Exceptional Items
0.00
0.00
Consolidate Net Profit
4.61
2.70
70.74%
Operating Profit Margin (Excl OI)
16.56%
14.67%
1.89%
Values in Rs Cr.
Direction Arrows
Net Sales

YoY Growth in quarter ended Sep 2025 is 11.55% vs 6.64% in Sep 2024

Direction Arrows
Consolidated Net Profit

YoY Growth in quarter ended Sep 2025 is 70.74% vs -53.12% in Sep 2024

Half Yearly Results Snapshot (Consolidated) - Sep'25stock-summary
Sep'25
Sep'24
Change(%)
Net Sales
225.21
207.49
8.54%
Operating Profit (PBDIT) excl Other Income
37.14
31.25
18.85%
Interest
7.39
6.89
7.26%
Exceptional Items
0.00
0.00
Consolidate Net Profit
10.01
10.08
-0.69%
Operating Profit Margin (Excl OI)
16.49%
15.06%
1.43%
Values in Rs Cr.
Direction Arrows
Net Sales

Growth in half year ended Sep 2025 is 8.54% vs 7.77% in Sep 2024

Direction Arrows
Consolidated Net Profit

Growth in half year ended Sep 2025 is -0.69% vs -19.17% in Sep 2024

Nine Monthly Results Snapshot (Consolidated) - Dec'24stock-summary
Dec'24
Dec'23
Change(%)
Net Sales
333.24
308.51
8.02%
Operating Profit (PBDIT) excl Other Income
57.36
56.20
2.06%
Interest
10.59
11.20
-5.45%
Exceptional Items
0.00
0.00
Consolidate Net Profit
19.33
26.30
-26.50%
Operating Profit Margin (Excl OI)
17.21%
18.22%
-1.01%
Values in Rs Cr.
Direction Arrows
Net Sales

YoY Growth in nine months ended Dec 2024 is 8.02% vs 7.32% in Dec 2023

Direction Arrows
Consolidated Net Profit

YoY Growth in nine months ended Dec 2024 is -26.50% vs -36.60% in Dec 2023

Annual Results Snapshot (Consolidated) - Mar'25stock-summary
Mar'25
Mar'24
Change(%)
Net Sales
436.25
404.70
7.80%
Operating Profit (PBDIT) excl Other Income
72.60
70.10
3.57%
Interest
14.23
14.60
-2.53%
Exceptional Items
0.00
0.00
Consolidate Net Profit
21.72
29.39
-26.10%
Operating Profit Margin (Excl OI)
16.64%
17.32%
-0.68%
Values in Rs Cr.
Direction Arrows
Net Sales

YoY Growth in year ended Mar 2025 is 7.80% vs 7.93% in Mar 2024

Direction Arrows
Consolidated Net Profit

YoY Growth in year ended Mar 2025 is -26.10% vs -69.64% in Mar 2024

stock-summaryCompany CV
About Speciality Restaurants Ltd stock-summary
stock-summary
Speciality Restaurants Ltd
Micro Cap
Leisure Services
Incorporated in 1999, Speciality Restaurants Limited is one of the largest chain of restaurants in the fine dining sector with restaurants across India, UAE (Dubai), Qatar (Doha), Tanzania (Dar e salam) and in UK (London). Their flagship brand Mainland China serve authentic Chinese cuisine with some new items on the Menu while it's offshoot i.e. Asia Kitchen by Mainland China serves pan-Asian cuisine in a semi-casual dining format.
Company Coordinates stock-summary
Company Details
Uniworth House, 3A Gurusaday Road Kolkata West Bengal : 700019
stock-summary
Tel: 91-33-22837964/65/66
stock-summary
corporate@speciality.co.in
Registrar Details
Link Intime India Pvt Ltd, C-13 Pannalal Silk Compound, L B S Marg, Bhandup , Mumbai