Spice LoungeFood

  • Market Cap: Small Cap
  • Industry: Non Banking Financial Company (NBFC)
  • ISIN: INE631E01024
  • NSEID:
  • BSEID: 539895
INR
22.32
1.06 (4.99%)
BSENSE

Sep 01, 03:30 PM

BSE+NSE Vol: 3.83 lacs

  • Price Points
  • Score
  • Mojo Parameters
  • Total Return
  • News and Corporate Actions
  • Key factors
  • Shareholding
  • Financials
  • CompanyCV
stock-summaryPrice Point
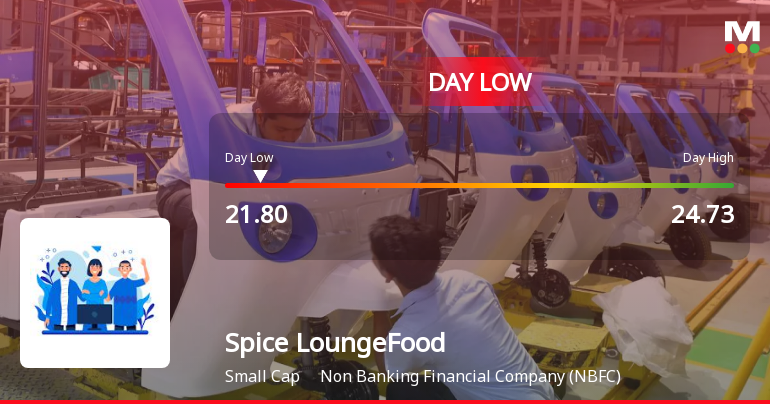
High/Low

1Day

52 Week

Valuation
Technical
Day's Volume

CASH

3.83 lacs (-52.15%) Volume

Shareholding (Jun 2026)

FII

0.00%

Held by 0 FIIs

DII

0.00%

Held by 0 DIIs

Promoter

64.37%

Why is Spice Lounge Food Works Ltd falling/rising?

02-Sep-2026

As of 01-Sep, Spice Lounge Food Works Ltd's stock price is rising to Rs 22.32, up 4.99%, driven by a trend reversal, increased investor participation, and strong financial results. However, the stock has a significant year-to-date decline of 44.14%, which may affect overall sentiment.

As of 01-Sep, Spice Lounge Food Works Ltd's stock price is rising, currently at Rs 22.32, reflecting an increase of Rs 1.06 or 4.99%. This rise can be attributed to several factors. Firstly, the stock has shown a trend reversal, gaining after three consecutive days of decline, which indicates a potential shift in market sentiment. Additionally, the stock has outperformed its sector by 6.45% today, suggesting that it is gaining traction relative to its peers.<BR><BR>Investor participation has also increased, with a significant rise in delivery volume of 14.96 lacs on August 31, which is up by 201.64% compared to the five-day average. This heightened interest from investors may be contributing to the upward price movement. Furthermore, positive financial results have been reported, with net sales for the latest six months growing by 29.99% to Rs 87.16 crore, and a higher profit after tax of Rs 12.24 crore over the past nine months, indicating strong operational performance.<BR><BR>Moreover, promoter confidence has strengthened, as they have increased their stake in the company by 64.37% over the previous quarter, which is often seen as a positive signal regarding the company's future prospects. However, it is important to note that despite the current rise, the stock has experienced significant declines over the longer term, with a year-to-date drop of 44.14% and a one-year decline of 51.95%. This context of long-term underperformance may temper the enthusiasm surrounding the recent price increase.

View full answer

Who are in the management team of Spice LoungeFood?

01-Sep-2026

The management team of Spice LoungeFood includes Natwarlal Ramgopal Modani, Sarapu Sowjanya, and Rahul Manoj Rawlyani as Independent Directors, Subramanyam Reddy Mallu as Director, Aditya Sreeramji Magapu as Whole-time Director, Surabhi Dayal as Company Secretary, and Jatavenkata Rama Raja Sekhar and Siva Prasad Gorthy as Additional Directors. Each member contributes to the company's strategic direction and operations.

The management team of Spice LoungeFood includes the following individuals:<BR><BR>1. Natwarlal Ramgopal Modani - Independent Director<BR>2. Sarapu Sowjanya - Independent Director<BR>3. Rahul Manoj Rawlyani - Independent Director<BR>4. Subramanyam Reddy Mallu - Director<BR>5. Aditya Sreeramji Magapu - Whole-time Director<BR>6. Surabhi Dayal - Company Secretary<BR>7. Jatavenkata Rama Raja Sekhar - Additional Director<BR>8. Siva Prasad Gorthy - Additional Director<BR><BR>Each member plays a crucial role in guiding the company's strategic direction and operations.

View full answer

What does Spice LoungeFood do?

01-Sep-2026

Spice Lounge Food Works Ltd is a Small Cap NBFC established in 1981, primarily involved in trading shares and securities. As of June 2026, it reported net sales of 40 Cr and a net profit of 5 Cr, with a market cap of INR 1,640 Cr.

Overview:<BR>Spice Lounge Food Works Ltd operates in the Non Banking Financial Company (NBFC) sector and is categorized as a Small Cap company.<BR><BR>History:<BR>The company was incorporated on 04th June, 1981, originally engaging in trading shares, bonds, and securities. It became a Public Limited Company and obtained its Certificate of Commencement of Business on 17th June, 1981. The latest quarterly results reported net sales and profit for June 2026.<BR><BR>Financial Snapshot:<BR>Net Sales: 40 Cr (Quarterly Results - Jun 2026) <BR>Net Profit: 5 Cr (Quarterly Results - Jun 2026) <BR>Market Cap: INR 1,640 Cr (Small Cap)<BR><BR>Key Metrics:<BR>P/E: 94.00 <BR>Industry P/E: 21 <BR>Dividend Yield: 0.00% <BR>Debt Equity: 0.96 <BR>Return on Equity: 7.88% <BR>Price to Book: 13.21 <BR><BR>Contact Details:<BR>Address: Flat 202-A 2nd Flr MJR Magnifi, Nanakramguda Cross Road Hyderabad Telangana : 500008 <BR>Email: shalimaragenciesltd@gmail.com <BR>Website: http://www.shalimaragencieslimited.com

View full answer

Who are the peers of the Spice LoungeFood?

01-Sep-2026

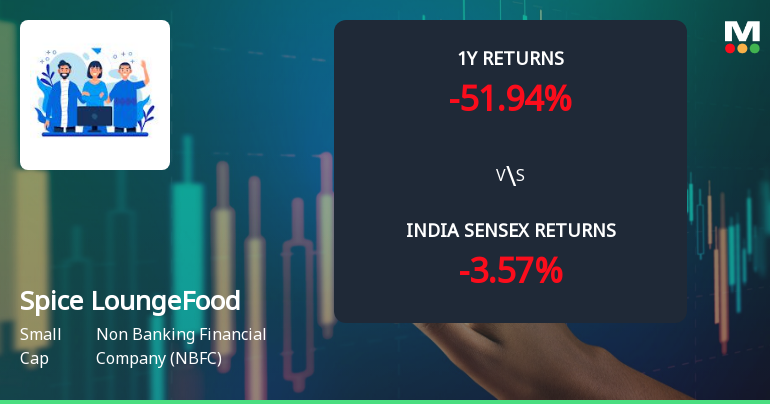
Spice LoungeFood's peers include Arman Financial, Shipping Land, Grand Oak Canyon, Algoquant Fin, PTC India Fin, Balmer Law. Inv., Summit Securitie, PNB Gilts, and Ugro Capital. Among these, Arman Financial has the highest 1-year return at 45.97%, while Spice LoungeFood has the lowest at -51.94%.

Peers: The peers of Spice LoungeFood are Arman Financial, Shipping Land, Grand Oak Canyon, Algoquant Fin, PTC India Fin, Balmer Law. Inv., Summit Securitie, PNB Gilts, and Ugro Capital.<BR><BR>Quality Snapshot: Excellent management risk is observed at Arman Financial, Algoquant Fin, and Spice LoungeFood, while Average management risk is found at Shipping Land and the rest. Below Average management risk is noted for Grand Oak Canyon, PTC India Fin, Balmer Law. Inv., Summit Securitie, PNB Gilts, and Ugro Capital. Growth is Excellent for Algoquant Fin, Spice LoungeFood, Summit Securitie, and Ugro Capital, while Good growth is seen at Arman Financial. Below Average growth is present at Shipping Land, Grand Oak Canyon, PTC India Fin, Balmer Law. Inv., and the rest. Capital Structure is Excellent for Arman Financial, Algoquant Fin, Spice LoungeFood, PTC India Fin, Balmer Law. Inv., Summit Securitie, and Ugro Capital, while Below Average capital structure is found at Shipping Land and PNB Gilts.<BR><BR>Return Snapshot: The peer with the highest 1-year return is Arman Financial at 45.97%, while the lowest is Spice LoungeFood at -51.94%. Spice LoungeFood's 1-year return is significantly lower than all its peers. Additionally, the six-month return is negative for Shipping Land, Grand Oak Canyon, Algoquant Fin, PTC India Fin, Summit Securitie, PNB Gilts, and Ugro Capital.

View full answer

How big is Spice LoungeFood?

01-Sep-2026

As of 31st August, Spice Lounge Food Works Ltd has a market capitalization of 1,640.00 Cr, with recent Net Sales of 166.28 Cr and a Net Profit of 15.68 Cr. The latest balance sheet shows Shareholder's Funds of 108.71 Cr and Total Assets of 199.82 Cr.

As of 31st August, Spice Lounge Food Works Ltd has a market capitalization of 1,640.00 Cr, categorizing it as a Small Cap company.<BR><BR>In the latest four quarters, the company reported Net Sales of 166.28 Cr and a Net Profit of 15.68 Cr.<BR><BR>The latest annual period for the balance sheet is March 2025, showing Shareholder's Funds of 108.71 Cr and Total Assets of 199.82 Cr.

View full answer

Should I buy, sell or hold Spice Lounge Food Works Ltd?

26-Aug-2026

Are Spice Lounge Food Works Ltd latest results good or bad?

14-Aug-2026

Spice Lounge Food Works Ltd's latest results show a significant turnaround with a net profit of ₹4.96 crores and strong revenue growth, but concerns remain due to a low return on equity of 5.09% and a 55.64% decline in stock value over six months, indicating mixed overall performance and market uncertainty.

Spice Lounge Food Works Ltd's latest results present a mixed picture. On one hand, the company reported a net profit of ₹4.96 crores for Q4 FY26, which is a significant turnaround from a loss of ₹3.64 crores in the same quarter last year. This represents a remarkable 100.81% increase in net profit quarter-over-quarter. Additionally, the company achieved a revenue of ₹47.02 crores, reflecting a 35.27% year-on-year growth and a 42.87% increase from the previous quarter.<BR><BR>The operating margin improved to 11.23%, the highest in seven quarters, indicating better cost management and operational efficiency. However, despite these positive developments, the return on equity (ROE) remains concerning at just 5.09%, which is below average for quality companies. This suggests that while the company is showing signs of profitability, it still struggles with capital efficiency.<BR><BR>Moreover, the stock has exhibited extreme volatility, with a significant decline of 55.64% over the past six months, raising questions about its long-term sustainability. The complete absence of institutional investors and the total exit of promoters from their holdings further complicate the outlook, signaling a lack of confidence in the company's future prospects.<BR><BR>In summary, while the recent quarterly results show improvement in profitability and revenue, the overall financial health and market perception of Spice Lounge Food Works remain concerning, making it a complex situation for investors.

View full answer

When is the next results date for Spice Lounge Food Works Ltd?

11-Aug-2026

The next results date for Spice Lounge Food Works Ltd is 14 August 2026.

The next results date for Spice Lounge Food Works Ltd is scheduled for 14 August 2026.

View full answer

Is Spice LoungeFood technically bullish or bearish?

05-Dec-2025

As of December 4, 2025, the trend is mildly bullish with supportive weekly MACD and moving averages, but caution is advised due to bearish monthly RSI and mildly bearish KST, indicating mixed signals and a lack of strong momentum.

As of 4 December 2025, the technical trend has changed from bullish to mildly bullish. The current stance is mildly bullish, supported by the weekly MACD being bullish and the daily moving averages also indicating bullishness. However, the monthly RSI shows bearish signals, and the KST is mildly bearish on the weekly timeframe, suggesting some caution. The Bollinger Bands are mildly bullish on both weekly and monthly charts, indicating a potential for upward movement, but the overall mixed signals from the indicators suggest a lack of strong momentum.

View full answer

How has been the historical performance of Spice LoungeFood?

03-Dec-2025

For the year ending March 2025, Spice LoungeFood reported an operating income of 0.66 crore and a profit after tax of 0.19 crore, with a debt-free status and an operating profit margin of 39.39%. The company had a cash flow from operating activities of 2.00 crore and a closing cash balance of 2.00 crore.

Answer:<BR>The historical performance of Spice LoungeFood for the year ending March 2025 shows a total operating income of 0.66 crore, with a total expenditure of 0.40 crore, resulting in an operating profit (PBDIT) of 0.26 crore. After accounting for tax of 0.07 crore, the profit after tax stands at 0.19 crore. The company has no long-term or short-term borrowings, indicating a debt-free status. The earnings per share (EPS) is reported at 0.0, with a diluted EPS of 0.08. The operating profit margin is 39.39%, while the profit after tax margin is 28.79%. <BR><BR>Breakdown:<BR>In March 2025, Spice LoungeFood achieved net sales of 0.66 crore, with no raw material or finished goods costs, leading to a total expenditure of 0.40 crore. This resulted in an operating profit of 0.26 crore, which translates to an operating profit margin of 39.39%. The profit before tax also stood at 0.26 crore, and after tax deductions of 0.07 crore, the profit after tax reached 0.19 crore, reflecting a PAT margin of 28.79%. The company maintains a strong balance sheet with total liabilities of 199.82 crore, consisting of shareholder's funds of 108.71 crore and total assets of the same amount. Cash flow from operating activities was 2.00 crore, contributing to a net cash inflow of 1.00 crore, with a closing cash and cash equivalent of 2.00 crore.

View full answer

Who are the top shareholders of the Shalimar Agencie?

17-Jul-2025

The top shareholders of Shalimar Agencie include Mohana Babu Karjela with 38.33% and It Trailblazers Resources Private Limited with 2.68%. Individual investors hold a combined 47.99%, while there are no mutual fund or foreign institutional investor holdings.

The top shareholders of Shalimar Agencie include Mohana Babu Karjela, who holds the largest public shareholding at 38.33%. Additionally, It Trailblazers Resources Private Limited is the promoter with the highest holding at 2.68%. Individual investors collectively hold 47.99% of the shares, while there are no holdings by mutual funds or foreign institutional investors. The majority of the shares are held by non-institutional shareholders.

View full answer

Is Shalimar Agencie overvalued or undervalued?

09-Jun-2025

As of May 31, 2025, Shalimar Agencie is considered very expensive with a PE ratio of 286.13, significantly higher than its peers, indicating it is overvalued despite impressive year-to-date returns of 159.89%.

As of 31 May 2025, Shalimar Agencie has moved from a grade of does not qualify to very expensive, indicating a significant shift in valuation perception. The company is currently overvalued, with a PE ratio of 286.13, a Price to Book Value of 14.87, and an EV to EBITDA of 127.73. These ratios suggest that the stock is trading at a premium compared to its earnings and book value.<BR><BR>In comparison to its peers, Shalimar Agencie stands out with an extraordinarily high PE ratio, while Life Insurance, a peer, has a more reasonable PE of 12.54, indicating a stark contrast in valuation. Additionally, Bajaj Finance Ltd. is also categorized as very expensive with a PE of 35.01, but it is still significantly lower than Shalimar Agencie. The recent stock performance has been impressive, with a year-to-date return of 159.89% compared to the Sensex's 5.61%, further emphasizing the disconnect between its high valuation and market performance.

View full answer

Has Shalimar Agencie declared dividend?

06-Jun-2025

No Dividend History Available

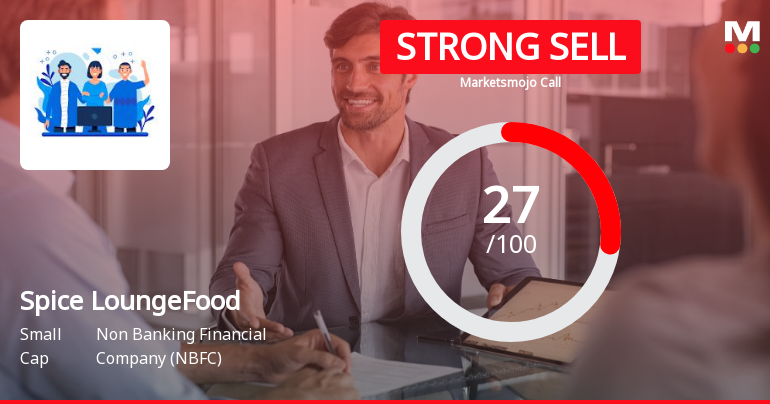
iScoreScore
Click here to find our call on this stock
Strong Sell
Sell
Hold
Buy
Strong Buy

Dashboard

1

Weak Long Term Fundamental Strength with an average Return on Equity (ROE) of 6.54%

 
2

With ROE of 7.9, it has a Very Expensive valuation with a 12.7 Price to Book Value

3

Below par performance in long term as well as near term

stock-summaryMojo Parameters

Mojo Parameters

Loading Valuation Snapshot...

Stock DNA

stock-summary
Industry

Non Banking Financial Company (NBFC)

stock-summary
Market cap

INR 1,556 Cr (Small Cap)

stock-summary
P/E

99.00

stock-summary
Industry P/E

21

stock-summary
Dividend Yield

0.00%

stock-summary
Debt Equity

0.96

stock-summary
Return on Equity

7.88%

stock-summary
Price to Book

11.99

Revenue and Profits:
Net Sales:
40 Cr
(Quarterly Results - Jun 2026)
Net Profit:
5 Cr
stock-summaryTotal Returns
Total Returns (Price + Dividend) stock-summary
Dividend Yield (0%)
TimePeriod
Price Return
Dividend Return
Total Return
3 Months
-8.9%
0%
-8.9%
6 Months
-32.75%
0%
-32.75%
1 Year
-51.95%
0%
-51.95%
2 Years
0%
0%
0.0%
3 Years
0%
0%
0.0%
4 Years
0%
0%
0.0%
5 Years
0%
0%
0.0%

Spice LoungeFood for the last several years.

Risk Adjusted Returns v/s stock-summary
Returns Beta
Icon
Beta has not been calculated since enough price history is not available
stock-summaryNews & Corporate Actions

Announcements stock-summary

Results - Un Audited Financial Results - 30.06.2026

14-Aug-2026 | Source : BSE

Results - Un Audited Financial Results - 30.06.2026

Board Meeting Outcome for UN-AUDITED FINANCIAL RESULTS - STANDALONE AND CONSOLIDATED FOR 30.06.2026

14-Aug-2026 | Source : BSE

UN-AUDITED FINANCIAL RESULTS - STANDALONE AND CONSOLIDATED FOR 30.06.2026

Announcement under Regulation 30 (LODR)-Press Release / Media Release

13-Aug-2026 | Source : BSE

Pursuant to Regulation 30 and other applicable provisions of the SEBI (Listing Obligations and Disclosure Requirements) Regulations 2015 we hereby submit the enclosed Press Release dated 12 August 2026 issued by Spice Lounge Food Works Limited (formerly Shalimar Agencies Limited).

Corporate Actions stock-summary

stock-summary
BOARD MEETING

No Upcoming Board Meetings

stock-summary
DIVIDEND

No Dividend history available

stock-summary
SPLITS

Spice Lounge Food Works Ltd has announced 1:10 stock split, ex-date: 13 Mar 25

stock-summary
BONUS

No Bonus history available

stock-summary
RIGHTS

No Rights history available

stock-summaryKey Factors

Quality key factors stock-summary

Factor
Value
Sales Growth (5y)
50.50%
EBIT Growth (5y)
59.04%
Net Debt to Equity (avg)
0.96
Institutional Holding
0
ROE (avg)
6.54%

Valuation key factors

Factor
Value
P/E Ratio
99
Industry P/E
21
Price to Book Value
12.65
EV to EBIT
289.84
EV to EBITDA
191.56
EV to Capital Employed
6.99
EV to Sales
10.56
PEG Ratio
2.25
Dividend Yield
NA
ROCE (Latest)
2.41%
ROE (Latest)
7.88%

Technicals key factors

Indicator
Weekly
Monthly
MACD
Mildly Bullish
Mildly Bearish
RSI
No Signal
No Signal
Bollinger Bands
Bearish
Mildly Bearish
Moving Averages
Bearish (Daily)
KST
Mildly Bullish
Mildly Bearish
Dow Theory
Mildly Bearish
Mildly Bearish
stock-summary Technical Indicator Scale: Bearish, Mildly Bearish, Sideways, Mildly Bullish, Bullish  Turned 
stock-summaryShareholding
Shareholding Snapshot : Jun 2026stock-summary
Shareholding Compare (%holding) stock-summary
Majority shareholders

Promoters

Pledged Promoter Holdings

None

Mutual Funds

Held by 0 Schemes

FIIs

Held by 0 FIIs

Promoter with highest holding

Mohana Babu Karjela (40.36%)

Highest Public shareholder

Siraj Holding Llc (17.21%)

Individual Investors Holdings

0.77%

stock-summaryFinancial
[
  {
    "link": "quarterly",
    "btn_text": "All Quarterly Results",
    "header": "Quarterly Results Snapshot (Standalone) - Jun'26 - YoY",
    "rhs": [
      {
        "prefix": "Net Sales ",
        "suffix": "YoY Growth in quarter ended Jun 2026 is 540.54% vs 0.00% in Jun 2025",
        "dir": 1
      },
      {
        "prefix": "Standalone Net Profit ",
        "suffix": "YoY Growth in quarter ended Jun 2026 is -70.59% vs 950.00% in Jun 2025",
        "dir": -1
      }
    ],
    "table": {
      "header": [
        "Jun'26",
        "Jun'25",
        "Change(%)"
      ],
      "body": [
        {
          "field": "Net Sales",
          "val1": "2.37",
          "val2": "0.37",
          "chgp": "540.54%",
          "chgp_class": "positive"
        },
        {
          "field": "Operating Profit (PBDIT) excl Other Income",
          "val1": "0.05",
          "val2": "0.23",
          "chgp": "-78.26%",
          "chgp_class": "negative"
        },
        {
          "field": "Interest",
          "val1": "0.00",
          "val2": "0.00",
          "chgp": "",
          "chgp_class": "neutral"
        },
        {
          "field": "Exceptional Items",
          "val1": "0.00",
          "val2": "0.00",
          "chgp": "",
          "chgp_class": "neutral"
        },
        {
          "field": "Standalone Net Profit",
          "val1": "0.05",
          "val2": "0.17",
          "chgp": "-70.59%",
          "chgp_class": "negative"
        },
        {
          "field": "Operating Profit Margin (Excl OI)",
          "val1": "2.11%",
          "val2": "62.16%",
          "chgp": "-60.05%",
          "chgp_class": "negative"
        }
      ]
    }
  },
  {
    "link": "half-yearly",
    "btn_text": "All Half Yearly Results",
    "header": "Half Yearly Results Snapshot (Standalone) - Sep'25",
    "rhs": [
      {
        "prefix": "Net Sales ",
        "suffix": " Growth in half year ended Sep 2025 is 681.82% vs 0.00% in Sep 2024",
        "dir": 1
      },
      {
        "prefix": "Standalone Net Profit ",
        "suffix": " Growth in half year ended Sep 2025 is 666.67% vs 0.00% in Sep 2024",
        "dir": 1
      }
    ],
    "table": {
      "header": [
        "Sep'25",
        "Sep'24",
        "Change(%)"
      ],
      "body": [
        {
          "field": "Net Sales",
          "val1": "0.86",
          "val2": "0.11",
          "chgp": "681.82%",
          "chgp_class": "positive"
        },
        {
          "field": "Operating Profit (PBDIT) excl Other Income",
          "val1": "0.30",
          "val2": "0.04",
          "chgp": "650.00%",
          "chgp_class": "positive"
        },
        {
          "field": "Interest",
          "val1": "0.08",
          "val2": "0.00",
          "chgp": "",
          "chgp_class": "neutral"
        },
        {
          "field": "Exceptional Items",
          "val1": "0.00",
          "val2": "0.00",
          "chgp": "",
          "chgp_class": "neutral"
        },
        {
          "field": "Standalone Net Profit",
          "val1": "0.23",
          "val2": "0.03",
          "chgp": "666.67%",
          "chgp_class": "positive"
        },
        {
          "field": "Operating Profit Margin (Excl OI)",
          "val1": "34.88%",
          "val2": "36.36%",
          "chgp": "-1.48%",
          "chgp_class": "negative"
        }
      ]
    }
  },
  {
    "link": "nine-monthly",
    "btn_text": "All Nine Monthly Results",
    "header": "Nine Monthly Results Snapshot (Standalone) - Dec'25",
    "rhs": [
      {
        "prefix": "Net Sales ",
        "suffix": "YoY Growth in nine months ended Dec 2025 is 258.82% vs 0.00% in Dec 2024",
        "dir": 1
      },
      {
        "prefix": "Standalone Net Profit ",
        "suffix": "YoY Growth in nine months ended Dec 2025 is 525.00% vs 0.00% in Dec 2024",
        "dir": 1
      }
    ],
    "table": {
      "header": [
        "Dec'25",
        "Dec'24",
        "Change(%)"
      ],
      "body": [
        {
          "field": "Net Sales",
          "val1": "1.22",
          "val2": "0.34",
          "chgp": "258.82%",
          "chgp_class": "positive"
        },
        {
          "field": "Operating Profit (PBDIT) excl Other Income",
          "val1": "0.33",
          "val2": "0.05",
          "chgp": "560.00%",
          "chgp_class": "positive"
        },
        {
          "field": "Interest",
          "val1": "0.09",
          "val2": "0.00",
          "chgp": "",
          "chgp_class": "neutral"
        },
        {
          "field": "Exceptional Items",
          "val1": "0.00",
          "val2": "0.00",
          "chgp": "",
          "chgp_class": "neutral"
        },
        {
          "field": "Standalone Net Profit",
          "val1": "0.25",
          "val2": "0.04",
          "chgp": "525.00%",
          "chgp_class": "positive"
        },
        {
          "field": "Operating Profit Margin (Excl OI)",
          "val1": "27.05%",
          "val2": "14.71%",
          "chgp": "12.34%",
          "chgp_class": "positive"
        }
      ]
    }
  },
  {
    "link": "annual",
    "btn_text": "All Annual Results",
    "header": "Annual Results Snapshot (Standalone) - Mar'26",
    "rhs": [
      {
        "prefix": "Net Sales ",
        "suffix": "YoY Growth in year ended Mar 2026 is 236.36% vs 0.00% in Mar 2025",
        "dir": 1
      },
      {
        "prefix": "Standalone Net Profit ",
        "suffix": "YoY Growth in year ended Mar 2026 is 36.84% vs 480.00% in Mar 2025",
        "dir": -1
      }
    ],
    "table": {
      "header": [
        "Mar'26",
        "Mar'25",
        "Change(%)"
      ],
      "body": [
        {
          "field": "Net Sales",
          "val1": "2.22",
          "val2": "0.66",
          "chgp": "236.36%",
          "chgp_class": "positive"
        },
        {
          "field": "Operating Profit (PBDIT) excl Other Income",
          "val1": "0.40",
          "val2": "0.26",
          "chgp": "53.85%",
          "chgp_class": "positive"
        },
        {
          "field": "Interest",
          "val1": "0.13",
          "val2": "0.00",
          "chgp": "",
          "chgp_class": "neutral"
        },
        {
          "field": "Exceptional Items",
          "val1": "0.00",
          "val2": "0.00",
          "chgp": "",
          "chgp_class": "neutral"
        },
        {
          "field": "Standalone Net Profit",
          "val1": "0.26",
          "val2": "0.19",
          "chgp": "36.84%",
          "chgp_class": "positive"
        },
        {
          "field": "Operating Profit Margin (Excl OI)",
          "val1": "18.02%",
          "val2": "39.39%",
          "chgp": "-21.37%",
          "chgp_class": "negative"
        }
      ]
    }
  }
]

Quarterly Results Snapshot (Standalone) - Jun'26 - YoYstock-summary

Jun'26
Jun'25
Change(%)
Net Sales
2.37
0.37
540.54%
Operating Profit (PBDIT) excl Other Income
0.05
0.23
-78.26%
Interest
0.00
0.00
Exceptional Items
0.00
0.00
Standalone Net Profit
0.05
0.17
-70.59%
Operating Profit Margin (Excl OI)
2.11%
62.16%
-60.05%
Values in Rs Cr.
Direction Arrows
Net Sales

YoY Growth in quarter ended Jun 2026 is 540.54% vs 0.00% in Jun 2025

Direction Arrows
Standalone Net Profit

YoY Growth in quarter ended Jun 2026 is -70.59% vs 950.00% in Jun 2025

Half Yearly Results Snapshot (Standalone) - Sep'25stock-summary

Sep'25
Sep'24
Change(%)
Net Sales
0.86
0.11
681.82%
Operating Profit (PBDIT) excl Other Income
0.30
0.04
650.00%
Interest
0.08
0.00
Exceptional Items
0.00
0.00
Standalone Net Profit
0.23
0.03
666.67%
Operating Profit Margin (Excl OI)
34.88%
36.36%
-1.48%
Values in Rs Cr.
Direction Arrows
Net Sales

Growth in half year ended Sep 2025 is 681.82% vs 0.00% in Sep 2024

Direction Arrows
Standalone Net Profit

Growth in half year ended Sep 2025 is 666.67% vs 0.00% in Sep 2024

Nine Monthly Results Snapshot (Standalone) - Dec'25stock-summary

Dec'25
Dec'24
Change(%)
Net Sales
1.22
0.34
258.82%
Operating Profit (PBDIT) excl Other Income
0.33
0.05
560.00%
Interest
0.09
0.00
Exceptional Items
0.00
0.00
Standalone Net Profit
0.25
0.04
525.00%
Operating Profit Margin (Excl OI)
27.05%
14.71%
12.34%
Values in Rs Cr.
Direction Arrows
Net Sales

YoY Growth in nine months ended Dec 2025 is 258.82% vs 0.00% in Dec 2024

Direction Arrows
Standalone Net Profit

YoY Growth in nine months ended Dec 2025 is 525.00% vs 0.00% in Dec 2024

Annual Results Snapshot (Standalone) - Mar'26stock-summary

Mar'26
Mar'25
Change(%)
Net Sales
2.22
0.66
236.36%
Operating Profit (PBDIT) excl Other Income
0.40
0.26
53.85%
Interest
0.13
0.00
Exceptional Items
0.00
0.00
Standalone Net Profit
0.26
0.19
36.84%
Operating Profit Margin (Excl OI)
18.02%
39.39%
-21.37%
Values in Rs Cr.
Direction Arrows
Net Sales

YoY Growth in year ended Mar 2026 is 236.36% vs 0.00% in Mar 2025

Direction Arrows
Standalone Net Profit

YoY Growth in year ended Mar 2026 is 36.84% vs 480.00% in Mar 2025

stock-summaryCompany CV
About Spice Lounge Food Works Ltd stock-summary
stock-summary
Spice Lounge Food Works Ltd
Small Cap
Non Banking Financial Company (NBFC)
Shalimar Agencies Limited was incorporated on 04th June, 1981 as a Public Limited Company obtained a Certificate of Commencement of Business on 17th June, 1981 in Durga Enclave, Hyderabad. Initially, the Company engaged in the business of trading in shares, bonds and securities. The Company got Equity Shares listed on BSE Limited since 25th May 2016. It was already listed on Metropolitan Stock Exchange of India Limited and Calcutta Stock Exchange Limited.
Company Coordinates stock-summary
Company Details
Flat 202-A 2nd Flr MJR Magnifi, Nanakramguda Cross Road Hyderabad Telangana : 500008
stock-summary
Tel:
stock-summary
shalimaragenciesltd@gmail.com
Registrar Details
Alankit Assignments Ltd , 205-208 , Anarkali Complex, Jhandewala Extension, New Delhi