
Compare Star Housing Fin with Similar Stocks
Stock DNA
Housing Finance Company
INR 53 Cr (Micro Cap)
8.00
21
1.43%
2.67
4.53%
0.38
Total Returns (Price + Dividend) 
Latest dividend: 0.07281337097146404 per share ex-dividend date: Sep-19-2025
Risk Adjusted Returns v/s
Returns Beta

News

Star Housing Finance Ltd is Rated Strong Sell
Star Housing Finance Ltd is rated Strong Sell by MarketsMOJO, with this rating last updated on 06 February 2026. However, the analysis and financial metrics discussed here reflect the stock’s current position as of 17 June 2026, providing investors with an up-to-date view of the company’s fundamentals, valuation, financial trends, and technical outlook.
Read full news article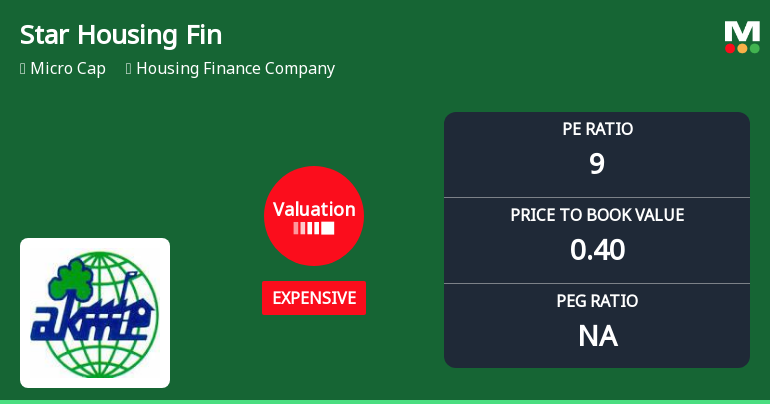
Star Housing Finance Ltd Valuation Shifts to Expensive Amid Market Challenges
Star Housing Finance Ltd, a micro-cap player in the housing finance sector, has seen its valuation parameters shift markedly from very attractive to expensive, reflecting growing investor caution amid deteriorating financial metrics and challenging market conditions. Despite a modest day gain of 1.72%, the stock’s year-to-date return remains deeply negative at -40.9%, significantly underperforming the Sensex’s -12.9% over the same period.
Read full news article
Star Housing Finance Ltd is Rated Strong Sell
Star Housing Finance Ltd is rated Strong Sell by MarketsMOJO. This rating was last updated on 06 Feb 2026. However, the analysis and financial metrics presented here reflect the stock’s current position as of 26 May 2026, providing investors with the latest insights into the company’s performance and outlook.
Read full news article Announcements
Announcement under Regulation 30 (LODR)-Change in Management
17-Jun-2026 | Source : BSEIntimation of appointment of Mr. Yogesh Limbachia (DIN: 11709935) as a Nominee Director of the Company.
Announcement under Regulation 30 (LODR)-Change in Management
13-Jun-2026 | Source : BSEIntimation of Appointment of Ms. Shweta Mehta as an Additional Director in the category of Non Executive Independent Director
Announcement Under Regulation 30 - Updates
23-May-2026 | Source : BSEAs per the attachment.
Corporate Actions

No Upcoming Board Meetings

Star Housing Finance Ltd has declared 2% dividend, ex-date: 19 Sep 25

Star Housing Finance Ltd has announced 5:10 stock split, ex-date: 16 Dec 22

Star Housing Finance Ltd has announced 1:1 bonus issue, ex-date: 16 Dec 22

Star Housing Finance Ltd has announced 7:9 rights issue, ex-date: 30 Sep 25
Quality key factors
Valuation key factors
Technicals key factors
 Technical Indicator Scale: Bearish, Mildly Bearish, Sideways, Mildly Bullish, Bullish Turned
 Shareholding Snapshot : Mar 2026
Shareholding Compare (%holding)
Non Institution
None
Held by 0 Schemes
Held by 0 FIIs
Pushpa Nagda (5.86%)
Arkfin Investments And Advisors Private Limited (15.94%)
48.5%
Quarterly Results Snapshot (Standalone) - Dec'25 - YoY

YoY Growth in quarter ended Dec 2025 is 9.59% vs 49.02% in Dec 2024
YoY Growth in quarter ended Dec 2025 is -75.98% vs -19.05% in Dec 2024
Half Yearly Results Snapshot (Standalone) - Sep'25
Growth in half year ended Sep 2025 is 15.87% vs 58.11% in Sep 2024
Growth in half year ended Sep 2025 is -47.86% vs 67.96% in Sep 2024
Nine Monthly Results Snapshot (Standalone) - Dec'25
YoY Growth in nine months ended Dec 2025 is 13.55% vs 54.63% in Dec 2024
YoY Growth in nine months ended Dec 2025 is -54.93% vs 32.25% in Dec 2024
Annual Results Snapshot (Standalone) - Mar'25
YoY Growth in year ended Mar 2025 is 58.84% vs 69.70% in Mar 2024
YoY Growth in year ended Mar 2025 is 25.00% vs 27.22% in Mar 2024
About Star Housing Finance Ltd

Company Coordinates


