
Compare Steel Exchange with Similar Stocks
Dashboard
Weak Long Term Fundamental Strength with an average Return on Capital Employed (ROCE) of 8.86%
- Poor long term growth as Net Sales has grown by an annual rate of 3.35% and Operating profit at 2.37% over the last 5 years
- Low ability to service debt as the company has a high Debt to EBITDA ratio of 3.19 times
The company has declared positive results in Mar'2026 after 2 consecutive negative quarters
With ROCE of 8.8, it has a Attractive valuation with a 1.6 Enterprise value to Capital Employed
Market Beating Performance
Stock DNA
Iron & Steel Products
INR 1,458 Cr (Micro Cap)
54.00
26
0.00%
0.52
3.52%
1.82
Total Returns (Price + Dividend) 
Latest dividend: 1 per share ex-dividend date: Sep-24-2009
Risk Adjusted Returns v/s
Returns Beta

News
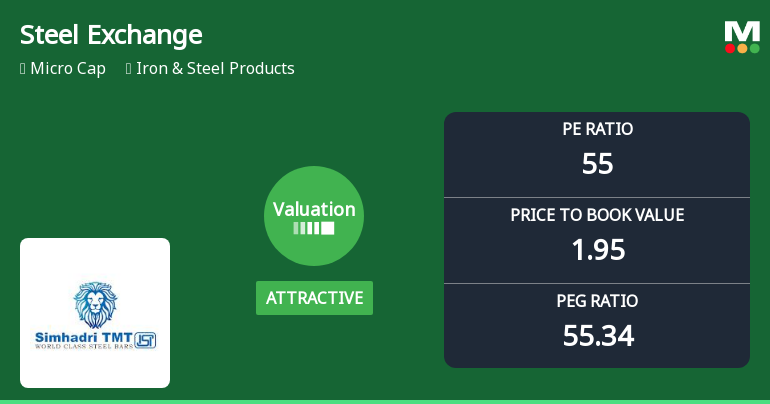
Steel Exchange India Ltd Valuation Shifts Signal Renewed Price Attractiveness
Steel Exchange India Ltd has seen a notable shift in its valuation parameters, moving from a fair to an attractive rating, driven primarily by changes in its price-to-earnings and price-to-book value ratios. Despite a recent dip in daily share price, the company’s longer-term returns significantly outperform the Sensex, signalling renewed investor interest amid evolving market dynamics.
Read full news article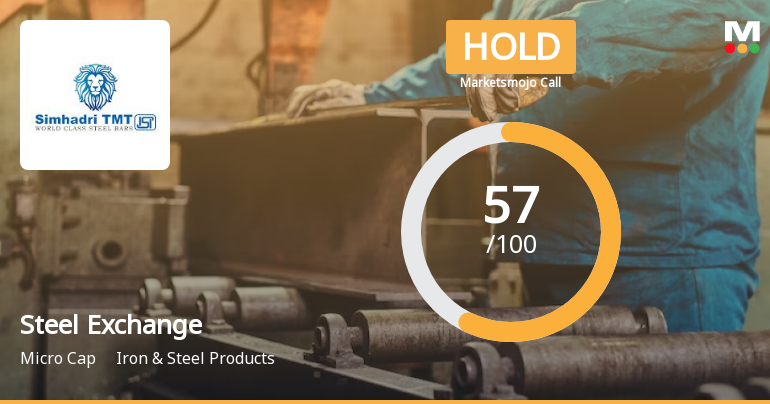
Steel Exchange India Ltd is Rated Hold
Steel Exchange India Ltd is rated 'Hold' by MarketsMOJO, with this rating last updated on 25 May 2026. However, the analysis and financial metrics discussed here reflect the company’s current position as of 04 June 2026, providing investors with an up-to-date view of its performance and prospects.
Read full news article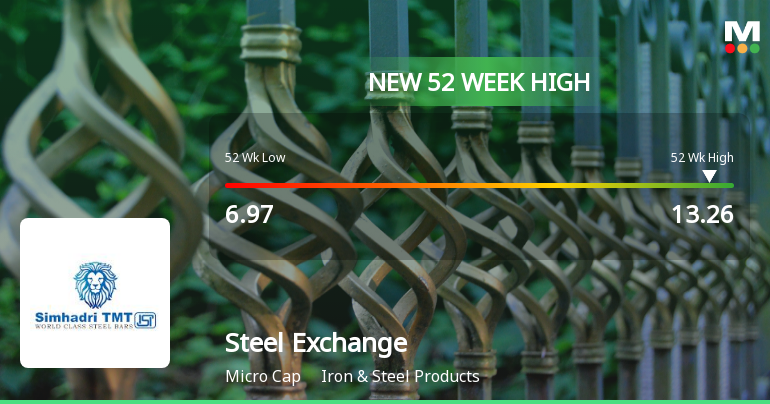
Broad-Based Technical Strength Lifts Steel Exchange India Ltd to 52-Week High of Rs 13.26
With a sustained rally that has propelled Steel Exchange India Ltd to a fresh 52-week high of Rs 13.26 on 1 Jun 2026, the stock’s momentum is underpinned by a confluence of bullish technical indicators and strong price action over recent sessions.
Read full news article Announcements
Compliances-Reg. 57 (1) - Certificate of interest payment/Principal in case of NCD
06-Jun-2026 | Source : BSEIntimation under Regulation 57(1) of SEBI LODR Regulations 2015 payment of Interest to Secured NCDs holders
Announcement under Regulation 30 (LODR)-Earnings Call Transcript
03-Jun-2026 | Source : BSEIntimation of Earnings Call Transcript
Compliances-Reg.24(A)-Annual Secretarial Compliance
30-May-2026 | Source : BSEAnnual Secretarial Compliance Report for the period from 01.04.2025 to 31.03.2026
Corporate Actions

No Upcoming Board Meetings

Steel Exchange India Ltd has declared 10% dividend, ex-date: 24 Sep 09

Steel Exchange India Ltd has announced 1:10 stock split, ex-date: 12 Jul 22

No Bonus history available

No Rights history available
Quality key factors
Valuation key factors
Technicals key factors
 Technical Indicator Scale: Bearish, Mildly Bearish, Sideways, Mildly Bullish, Bullish Turned
 Shareholding Snapshot : Apr 2026
Shareholding Compare (%holding)
Promoters
99.9475
Held by 3 Schemes (0.0%)
Held by 7 FIIs (0.29%)
Umashiv Garments Private Ltd (19.3%)
Vishwa Samudra Holdings Private Limited (4.74%)
32.54%
Quarterly Results Snapshot (Standalone) - Mar'26 - QoQ

QoQ Growth in quarter ended Mar 2026 is 19.55% vs 3.71% in Dec 2025
QoQ Growth in quarter ended Mar 2026 is 442.54% vs 8.06% in Dec 2025
Half Yearly Results Snapshot (Standalone) - Sep'25
Growth in half year ended Sep 2025 is 1.44% vs 0.68% in Sep 2024

Growth in half year ended Sep 2025 is 132.39% vs 158.48% in Sep 2024
Nine Monthly Results Snapshot (Standalone) - Dec'25
YoY Growth in nine months ended Dec 2025 is -9.35% vs 9.62% in Dec 2024
YoY Growth in nine months ended Dec 2025 is -30.94% vs 338.67% in Dec 2024
Annual Results Snapshot (Standalone) - Mar'26
YoY Growth in year ended Mar 2026 is -7.39% vs 5.04% in Mar 2025
YoY Growth in year ended Mar 2026 is 4.09% vs 138.11% in Mar 2025
About Steel Exchange India Ltd

Company Coordinates


