
Compare Sterling & Wils. with Similar Stocks
Dashboard
Weak Long Term Fundamental Strength with an average Return on Capital Employed (ROCE) of 8.22%
- Poor long term growth as Net Sales has grown by an annual rate of 8.24% over the last 5 years
- Low ability to service debt as the company has a high Debt to EBITDA ratio of 3.94 times
27.62% of Promoter Shares are Pledged
Underperformed the market in the last 1 year
Stock DNA
Construction
INR 4,612 Cr (Small Cap)
17.00
34
0.00%
1.01
43.33%
6.94
Total Returns (Price + Dividend) 
Latest dividend: 6 per share ex-dividend date: Feb-24-2020
Risk Adjusted Returns v/s
Returns Beta

News

Sterling & Wilson Renewable Energy Ltd Surges 7.07% to Day's High of Rs 208.15 — Outperforms Sector by 4.95 Percentage Points
The Sensex climbed 2.11% on 12 Jun 2026, yet Sterling & Wilson Renewable Energy Ltd outpaced the broader market with a 7.07% gain, reaching an intraday high of Rs 208.15. This 4.95-percentage-point outperformance over the Engineering sector’s 2.13% advance signals a distinctly stock-specific rally rather than a mere market tailwind.
Read full news article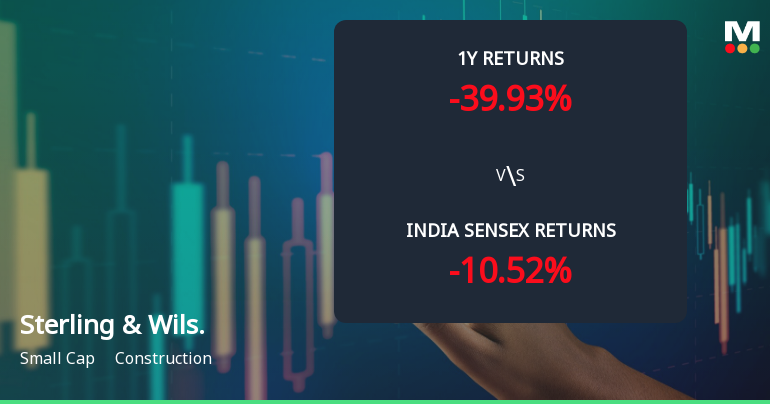
Sterling & Wilson Renewable Energy Ltd: Technical Momentum Shifts Amid Bearish Pressure
Sterling & Wilson Renewable Energy Ltd (S&W Renewable) has experienced a notable shift in price momentum and technical indicators, reflecting a complex market sentiment. The stock’s recent mild bearish trend contrasts with some bullish signals on longer-term charts, underscoring the challenges faced by this small-cap construction sector player amid broader market pressures.
Read full news article
Sterling & Wilson Renewable Energy Ltd Technical Momentum Shifts Amid Market Volatility
Sterling & Wilson Renewable Energy Ltd has experienced a notable shift in its technical momentum, moving from a mildly bearish stance to a sideways trend as of early June 2026. Despite a recent downgrade in its Mojo Grade to 'Sell' from 'Strong Sell', the stock's technical indicators present a complex picture, with mixed signals from MACD, RSI, moving averages, and other momentum oscillators. This analysis delves into the nuances of these technical parameters and their implications for investors navigating the construction sector's small-cap landscape.
Read full news article Announcements
Announcement under Regulation 30 (LODR)-Newspaper Publication
10-Jun-2026 | Source : BSEPursuant to Regulation 30 of the SEBI Listing Regulations please find enclosed the newspaper publication with respect to information on the 9th AGM of the Company published in Financial Express and Navshakti on Wednesday June 10 2026.
Annual Report Of Sterling And Wilson Renewable Energy Limited For The Financial Year 2025-26 Along With The Notice Of The 9Th Annual General Meeting Of The Company
09-Jun-2026 | Source : BSEPursuant to Regulations 30 and 34 of the SEBI Listing Regulations please find enclosed herewith the Annual Report of the Company for the Financial Year 2025-26 along with the Notice of the 9th AGM of the Members of the Company. The Notice of the 9th AGM is given on Page Nos. 30 to 47 of the Annual Report.
Business Responsibility and Sustainability Reporting (BRSR)
09-Jun-2026 | Source : BSEPursuant to Regulation 34(2)(f) of the SEBI Listing Regulations we are enclosing herewith the Business Responsibility and Sustainability Report for FY 2025-26 along with an Independent Sustainability Assurance Statement provided by P Cube C Services LLP which also forms part of the Annual Report for FY 2025-26.
Corporate Actions

No Upcoming Board Meetings

Sterling & Wilson Renewable Energy Ltd has declared 600% dividend, ex-date: 24 Feb 20

No Splits history available

No Bonus history available

No Rights history available
Quality key factors
Valuation key factors
Technicals key factors
 Technical Indicator Scale: Bearish, Mildly Bearish, Sideways, Mildly Bullish, Bullish Turned
 Shareholding Snapshot : Mar 2026
Shareholding Compare (%holding)
Promoters
27.6222
Held by 7 Schemes (0.51%)
Held by 86 FIIs (6.97%)
Reliance New Energy Limited (32.49%)
Aditya Birla Sun Life Insurance Company Limited (2.59%)
36.95%
Quarterly Results Snapshot (Consolidated) - Mar'26 - QoQ

QoQ Growth in quarter ended Mar 2026 is -7.01% vs 19.65% in Dec 2025

QoQ Growth in quarter ended Mar 2026 is 4,958.12% vs 99.41% in Dec 2025
Half Yearly Results Snapshot (Consolidated) - Sep'25
Growth in half year ended Sep 2025 is 80.42% vs 52.65% in Sep 2024
Growth in half year ended Sep 2025 is -4,025.53% vs 107.51% in Sep 2024
Nine Monthly Results Snapshot (Consolidated) - Dec'25
YoY Growth in nine months ended Dec 2025 is 48.10% vs 103.66% in Dec 2024
YoY Growth in nine months ended Dec 2025 is -1,803.11% vs 112.22% in Dec 2024
Annual Results Snapshot (Consolidated) - Mar'26
YoY Growth in year ended Mar 2026 is 19.77% vs 107.61% in Mar 2025
YoY Growth in year ended Mar 2026 is -479.90% vs 138.43% in Mar 2025
About Sterling & Wilson Renewable Energy Ltd

Company Coordinates


