
Compare STL Networks with Similar Stocks
Dashboard
Weak Long Term Fundamental Strength with a 0% CAGR growth in Operating Profits over the last 5 years
- Low ability to service debt as the company has a high Debt to EBITDA ratio of 21.46 times
- The company has been able to generate a Return on Equity (avg) of 109.08% signifying low profitability per unit of shareholders funds
Negative results in Jun 26
With ROCE of 0.1, it has a Expensive valuation with a 1.2 Enterprise value to Capital Employed
Falling Participation by Institutional Investors
Stock DNA
Telecom - Services
INR 1,133 Cr (Micro Cap)
NA (Loss Making)
41
0.00%
1.06
-11.74%
1.43
Total Returns (Price + Dividend) 
STL Networks for the last several years.
Risk Adjusted Returns v/s
Returns Beta

News
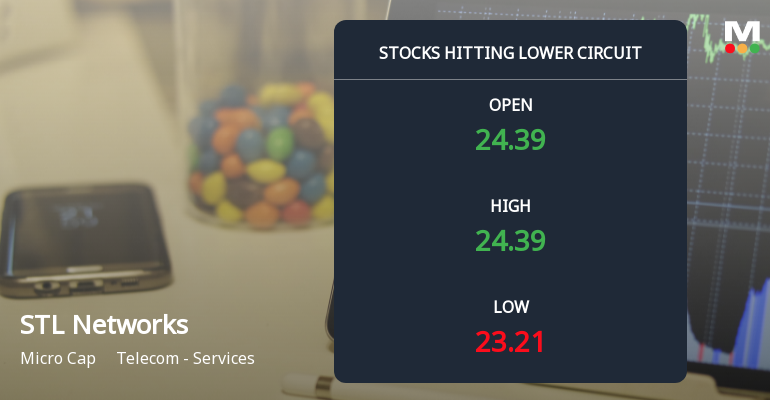
STL Networks Ltd Locks at Lower Circuit With 4.67% Loss — Sellers Queue, No Buyers in Sight
At Rs 23.29, STL Networks Ltd locked at its lower circuit on 29 Jul 2026, falling 4.67% within a 5% price band. Sellers were lined up to exit, but no buyers emerged to absorb the supply, resulting in a frozen price and unfilled sell orders — how severe is the selling pressure and what does it mean for liquidity?
Read full news article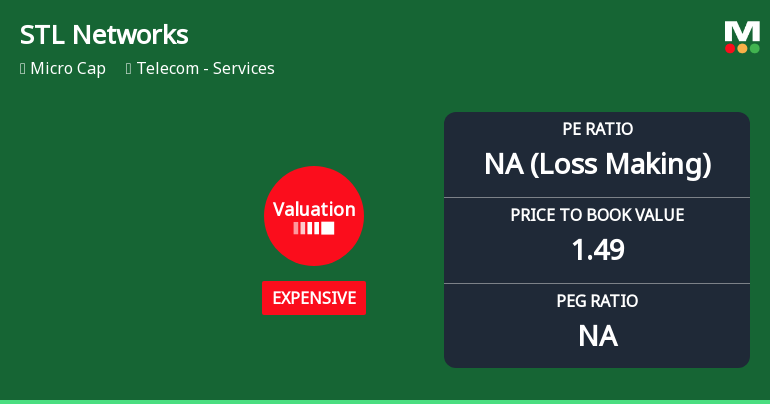
STL Networks Ltd Valuation Shifts Signal Price Attractiveness Decline Amid Sector Challenges
STL Networks Ltd, a micro-cap player in the Telecom - Services sector, has seen its valuation parameters shift markedly, moving from an attractive to an expensive rating. Despite a year-to-date stock return of 10.3% outperforming the Sensex’s negative 9.9%, the company’s deteriorating financial metrics and valuation multiples have prompted a downgrade in its Mojo Grade from Strong Sell to Sell as of 30 June 2026.
Read full news article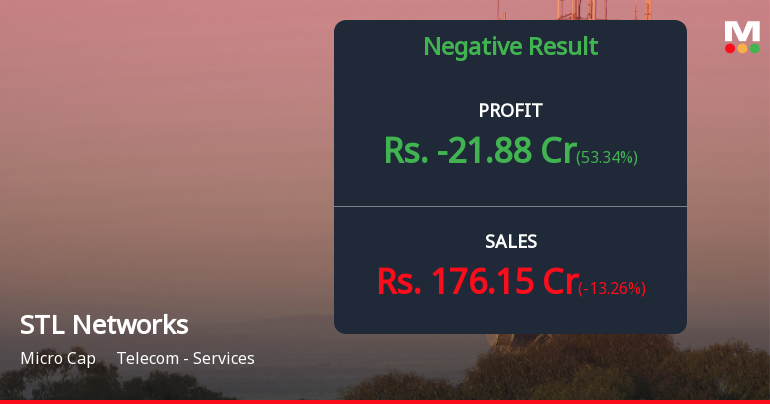
STL Networks Q1 FY27: Losses Deepen Amid Revenue Decline and Mounting Interest Burden
STL Networks Ltd., a micro-cap telecom services provider with a market capitalisation of ₹1,250 crores, reported widening losses in Q1 FY27 as revenue contracted and interest expenses surged to record levels. The company posted a net loss of ₹21.88 crores for the quarter ended June 2026, representing a 53.34% sequential deterioration from Q4 FY26's loss of ₹46.89 crores, though marginally better than the ₹22.42 crore loss in the corresponding quarter last year. The stock plummeted 4.98% to ₹24.43 following the results announcement, reflecting investor concerns about the company's deteriorating financial health and mounting debt servicing obligations.
Read full news article Announcements
Corporate Actions

No Upcoming Board Meetings

No Dividend history available

No Splits history available

No Bonus history available

No Rights history available
Quality key factors
Valuation key factors
Technicals key factors
 Technical Indicator Scale: Bearish, Mildly Bearish, Sideways, Mildly Bullish, Bullish Turned
 Shareholding Snapshot : Jun 2026
Shareholding Compare (%holding)
Non Institution
None
Held by 4 Schemes (2.06%)
Held by 38 FIIs (1.12%)
Twin Star Overseas Ltd (42.9%)
Uno Metals Ltd (2.51%)
37.34%
Quarterly Results Snapshot (Consolidated) - Jun'26 - QoQ

QoQ Growth in quarter ended Jun 2026 is -13.26% vs -39.40% in Mar 2026
QoQ Growth in quarter ended Jun 2026 is 53.34% vs -346.15% in Mar 2026
Half Yearly Results Snapshot (Standalone) - Sep'25
Not Applicable: The company has declared_date for only one period
Not Applicable: The company has declared_date for only one period
Nine Monthly Results Snapshot (Standalone) - Dec'25
Not Applicable: The company has declared_date for only one period
Not Applicable: The company has declared_date for only one period
Annual Results Snapshot (Standalone) - Mar'26
Not Applicable: The company has declared_date for only one period
Not Applicable: The company has declared_date for only one period
About STL Networks Ltd

Company Coordinates


