
Compare Stylam Industrie with Similar Stocks
Stock DNA
Plywood Boards/ Laminates
INR 5,446 Cr (Small Cap)
37.00
32
0.00%
-0.05
18.57%
6.68
Total Returns (Price + Dividend) 
Latest dividend: 2.5026413478012564 per share ex-dividend date: Nov-17-2023
Risk Adjusted Returns v/s
Returns Beta

News

Stylam Industries Ltd is Rated Buy by MarketsMOJO
Stylam Industries Ltd is rated Buy by MarketsMOJO, with this rating last updated on 08 May 2026. However, the analysis and financial metrics discussed here reflect the company’s current position as of 13 June 2026, providing investors with the most up-to-date view of the stock’s fundamentals, returns, and technical outlook.
Read full news article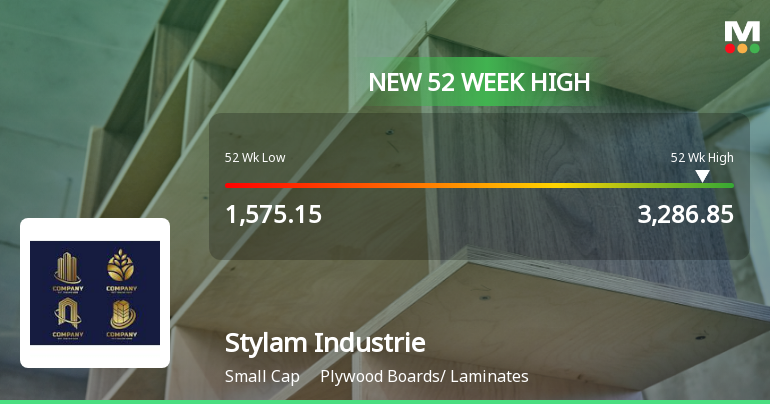
Broad-Based Technical Strength Lifts Stylam Industries Ltd to 52-Week High of Rs 3286.85
With a remarkable surge to Rs 3286.85 on 8 Jun 2026, Stylam Industries Ltd has reached a fresh 52-week and all-time high, propelled by a confluence of strong technical indicators and sustained price momentum.
Read full news article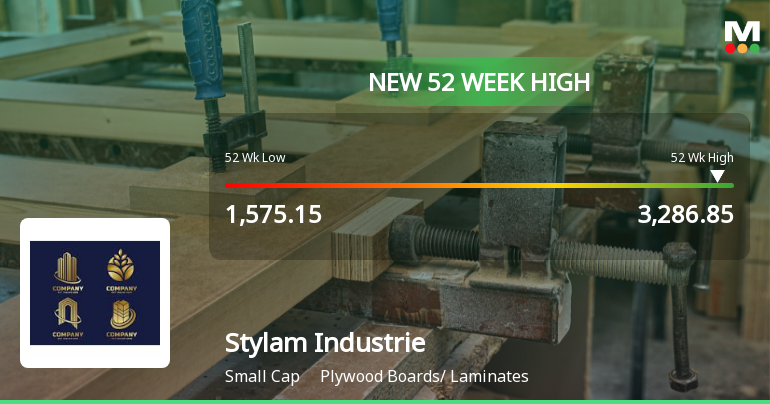
Broad-Based Technical Strength Lifts Stylam Industries Ltd to 52-Week High of Rs 3060
With every major technical indicator aligned to the upside, Stylam Industries Ltd surged to a fresh 52-week high of Rs 3,060 on 4 Jun 2026, marking a significant milestone in its price momentum journey.
Read full news article Announcements
Announcement under Regulation 30 (LODR)-Analyst / Investor Meet - Intimation
09-Jun-2026 | Source : BSEINTIMATION OF SCHEDULE OF INVESTORS/ANALYST MEETING UNDER REGULATION 30 OF SEBI (LISTING OBLIGATIONS AND DISCLOSURE REQUIREMENTS) REGULATIONS 2015
Compliances-Reg.24(A)-Annual Secretarial Compliance
22-May-2026 | Source : BSESecretarial Compliance Report of Stylam Industries Limited for the year ended March 31 2026.
Post-Offer Advertisement
20-May-2026 | Source : BSEICICI Securities Ltd (Manager to the Open Offer) has submitted to BSE a copy of Post-Offer Advertisement in accordance with Regulation 18(12) of the Securities and Exchange Board of India (Substantial Acquisition of Shares and Takeovers) Regulations 2011 as amended for the attention of the Public Shareholders of Stylam Industries Ltd (Target Company).
Corporate Actions

No Upcoming Board Meetings

Stylam Industries Ltd has declared 50% dividend, ex-date: 17 Nov 23

Stylam Industries Ltd has announced 5:10 stock split, ex-date: 12 Apr 21

No Bonus history available

No Rights history available
Quality key factors
Valuation key factors
Technicals key factors
 Technical Indicator Scale: Bearish, Mildly Bearish, Sideways, Mildly Bullish, Bullish Turned
 Shareholding Snapshot : Mar 2026
Shareholding Compare (%holding)
Promoters
None
Held by 7 Schemes (8.99%)
Held by 45 FIIs (2.8%)
Aica Kogyo Company Limited (27.12%)
Dsp Small Cap Fund (2.57%)
21.59%
Quarterly Results Snapshot (Consolidated) - Mar'26 - YoY

YoY Growth in quarter ended Mar 2026 is 6.66% vs 10.59% in Mar 2025

YoY Growth in quarter ended Mar 2026 is 29.31% vs -21.27% in Mar 2025
Half Yearly Results Snapshot (Consolidated) - Sep'25
Growth in half year ended Sep 2025 is 13.87% vs 9.94% in Sep 2024
Growth in half year ended Sep 2025 is 5.03% vs 4.94% in Sep 2024
Nine Monthly Results Snapshot (Consolidated) - Dec'25
YoY Growth in nine months ended Dec 2025 is 11.39% vs 12.70% in Dec 2024
YoY Growth in nine months ended Dec 2025 is 20.96% vs 1.57% in Dec 2024
Annual Results Snapshot (Consolidated) - Mar'26
YoY Growth in year ended Mar 2026 is 10.16% vs 12.14% in Mar 2025
YoY Growth in year ended Mar 2026 is 22.98% vs -5.12% in Mar 2025
About Stylam Industries Ltd

Company Coordinates


