
Compare Subex with Similar Stocks
Dashboard
Weak Long Term Fundamental Strength with a -28.06% CAGR growth in Operating Profits over the last 5 years
- Company's ability to service its debt is weak with a poor EBIT to Interest (avg) ratio of -4.83
- The company has been able to generate a Return on Equity (avg) of 2.55% signifying low profitability per unit of shareholders funds
Despite the size of the company, domestic mutual funds hold only 0% of the company
Consistent Underperformance against the benchmark over the last 3 years
Stock DNA
Software Products
INR 579 Cr (Micro Cap)
19.00
20
0.00%
-0.28
9.03%
1.67
Total Returns (Price + Dividend) 
Latest dividend: 0.25 per share ex-dividend date: Jul-01-2021
Risk Adjusted Returns v/s
Returns Beta

News

Subex Ltd is Rated Sell by MarketsMOJO
Subex Ltd is rated 'Sell' by MarketsMOJO, with this rating last updated on 18 May 2026. However, the analysis and financial metrics discussed here reflect the stock's current position as of 10 June 2026, providing investors with an up-to-date view of the company’s fundamentals, returns, and technical outlook.
Read full news article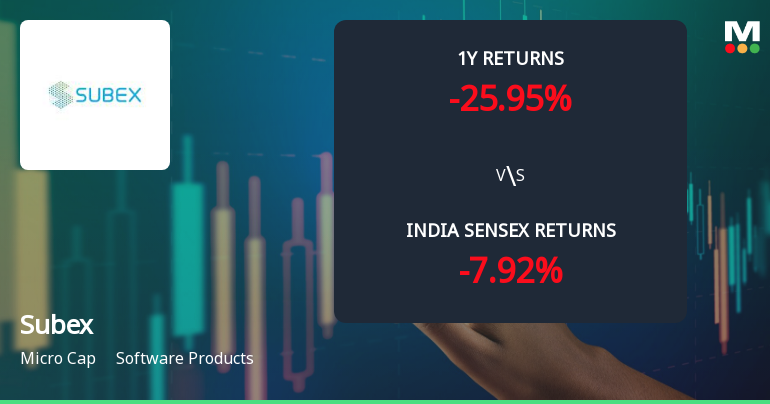
Subex Ltd Technical Momentum Shifts Amid Mixed Market Signals
Subex Ltd, a micro-cap player in the Software Products sector, has exhibited a notable shift in its technical momentum, moving from a mildly bearish stance to a sideways trend. Despite a modest day gain of 0.85% to close at ₹10.73, the stock’s technical indicators present a complex picture, reflecting both bullish and bearish signals across different timeframes. This analysis delves into the recent technical parameter changes, evaluating key indicators such as MACD, RSI, moving averages, and others to provide a comprehensive view of Subex’s current market positioning.
Read full news article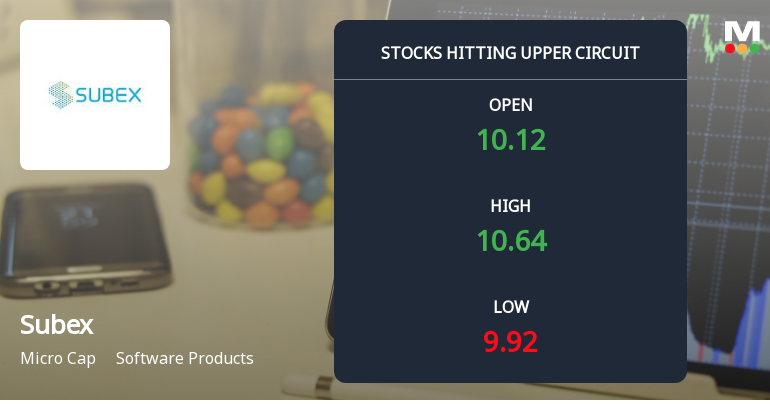
Subex Ltd Locks at Upper Circuit With 4.91% Gain — Buyers Queue, Sellers Absent
At Rs 10.69, the buying was done — not because demand dried up, but because the exchange wouldn't let the stock go any higher. Subex Ltd locked at its upper circuit of 4.91% on 2 Jun 2026, with buyers queuing and no sellers willing to part with shares.
Read full news article Announcements
Announcement under Regulation 30 (LODR)-Analyst / Investor Meet - Intimation
08-Jun-2026 | Source : BSEIntimation of Schedule of Analyst/ Institutional Investor meet - Non-Deal Roadshow
Disclosure Under Regulation 30 Of SEBI (Listing Obligations And Disclosure Requirements) Regulations 2015 - Imposition Of Fine By Stock Exchanges
28-May-2026 | Source : BSEDisclosure under Regulation 30 of SEBI (Listing Obligations and Disclosure Requirements) Regulations 2015 - Imposition of fine by Stock Exchanges
Compliances-Reg.24(A)-Annual Secretarial Compliance
21-May-2026 | Source : BSESecretarial Compliance Report for the year ended March 31 2026
Corporate Actions

No Upcoming Board Meetings

Subex Ltd has declared 5% dividend, ex-date: 01 Jul 21

No Splits history available

No Bonus history available

No Rights history available
Quality key factors
Valuation key factors
Technicals key factors
 Technical Indicator Scale: Bearish, Mildly Bearish, Sideways, Mildly Bullish, Bullish Turned
 Shareholding Snapshot : Mar 2026
Shareholding Compare (%holding)
Non Institution
None
Held by 0 Schemes
Held by 20 FIIs (1.1%)
None
Uno Metals Ltd (3.41%)
87.13%
Quarterly Results Snapshot (Consolidated) - Mar'26 - QoQ

QoQ Growth in quarter ended Mar 2026 is 3.07% vs 2.73% in Dec 2025
QoQ Growth in quarter ended Mar 2026 is 238.91% vs 2.45% in Dec 2025
Half Yearly Results Snapshot (Consolidated) - Sep'25

Growth in half year ended Sep 2025 is -4.93% vs -1.24% in Sep 2024
Growth in half year ended Sep 2025 is 247.97% vs 65.08% in Sep 2024
Nine Monthly Results Snapshot (Consolidated) - Dec'25
YoY Growth in nine months ended Dec 2025 is -4.14% vs -4.83% in Dec 2024
YoY Growth in nine months ended Dec 2025 is 234.39% vs 60.70% in Dec 2024
Annual Results Snapshot (Consolidated) - Mar'26
YoY Growth in year ended Mar 2026 is -2.29% vs -7.78% in Mar 2025
YoY Growth in year ended Mar 2026 is 190.74% vs 83.60% in Mar 2025
About Subex Ltd

Company Coordinates


