
Compare Sugs Lloyd with Similar Stocks
Dashboard
High Management Efficiency with a high ROCE of 69.17%
Healthy long term growth as Net Sales has grown by an annual rate of 170.50% and Operating profit at 181.71%
Flat results in Dec 25
With ROCE of 21, it has a Very Attractive valuation with a 1.6 Enterprise value to Capital Employed
Majority shareholders : Promoters
Stock DNA
Other Electrical Equipment
INR 267 Cr (Micro Cap)
12.00
56
0.00%
0.50
20.91%
2.00
Total Returns (Price + Dividend) 
Sugs Lloyd for the last several years.
Risk Adjusted Returns v/s
Returns Beta

News
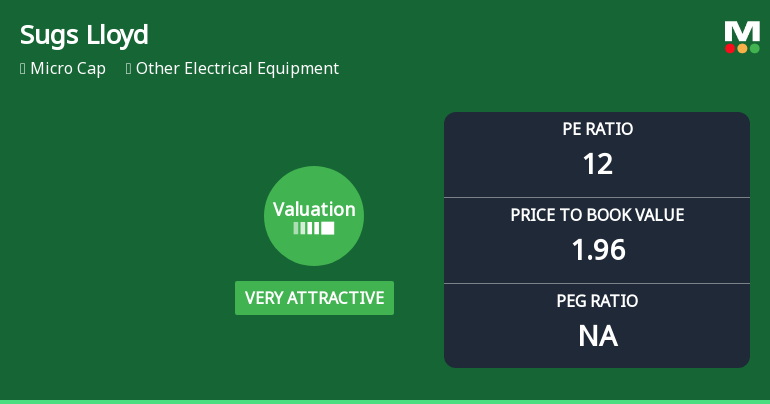
Sugs Lloyd Ltd Valuation Shifts to Very Attractive Amidst Sector Volatility
Sugs Lloyd Ltd, a micro-cap player in the Other Electrical Equipment sector, has witnessed a notable shift in its valuation parameters, moving from an attractive to a very attractive rating. This change reflects a significant improvement in price metrics such as the price-to-earnings (P/E) and price-to-book value (P/BV) ratios, positioning the stock as a compelling consideration amid a challenging market backdrop.
Read full news article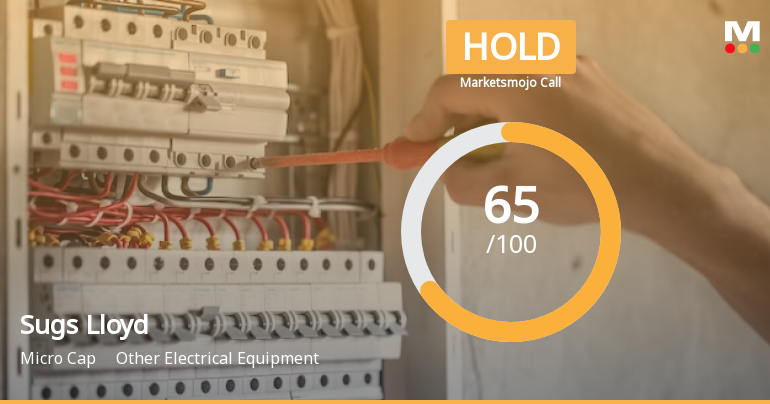
Sugs Lloyd Ltd is Rated Hold by MarketsMOJO
Sugs Lloyd Ltd is rated Hold by MarketsMOJO, with this rating last updated on 12 May 2026. While the rating was assigned on that date, the analysis and financial metrics discussed here reflect the stock’s current position as of 04 June 2026, providing investors with the most up-to-date perspective on the company’s performance and outlook.
Read full news article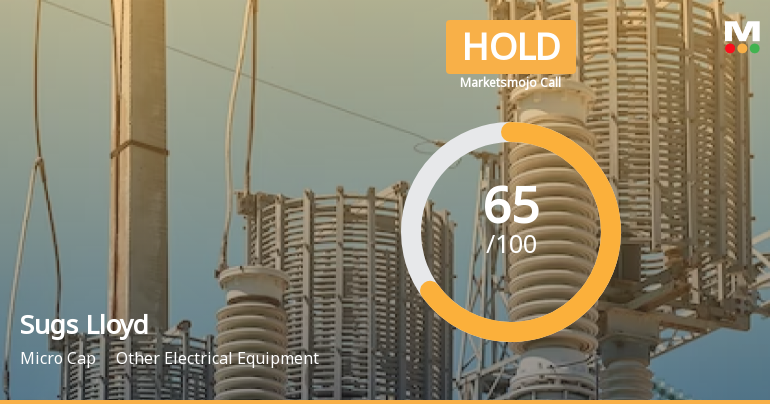
Sugs Lloyd Ltd is Rated Hold by MarketsMOJO
Sugs Lloyd Ltd is rated 'Hold' by MarketsMOJO, with this rating last updated on 12 May 2026. However, the analysis and financial metrics presented here reflect the stock's current position as of 24 May 2026, providing investors with the latest insights into the company’s performance and outlook.
Read full news article Announcements
Compliances-Reg.24(A)-Annual Secretarial Compliance
29-May-2026 | Source : BSEAnnual Secretarial Compliance Report
Announcement under Regulation 30 (LODR)-Earnings Call Transcript
22-May-2026 | Source : BSETranscript of Earnings Call pertaining to the Audited Financial Results (Standalone & Consolidated) of the company for the Half year and year ended 31st March 2026.
Regulation 7(2)(B) Of The SEBI (Prohibition Of Insider Trading) Regulations 2015
21-May-2026 | Source : BSEWe are hereby submitting the disclosure pursuant to Regulation 7(2)(b) of the SEBI (Prohibition of Insider Trading) Regulations 2015.
Corporate Actions

No Upcoming Board Meetings

No Dividend history available

No Splits history available

No Bonus history available

No Rights history available
Quality key factors
Valuation key factors
Technicals key factors
 Technical Indicator Scale: Bearish, Mildly Bearish, Sideways, Mildly Bullish, Bullish Turned
 Shareholding Snapshot : Mar 2026
Shareholding Compare (%holding)
Promoters
None
Held by 0 Schemes
Held by 1 FIIs (1.02%)
Priti Shah (70.0%)
Rajesh Kumar Singla (1.72%)
22.17%
Quarterly Results Snapshot (Standalone) - Dec'25 - QoQ

QoQ Growth in quarter ended Dec 2025 is -1.65% vs 7.09% in Sep 2025
QoQ Growth in quarter ended Dec 2025 is 1.16% vs 4.15% in Sep 2025
Half Yearly Results Snapshot (Consolidated) - Mar'26

Growth in half year ended Mar 2026 is 44.43% vs 9.03% in Sep 2025
Growth in half year ended Mar 2026 is 43.62% vs 17.83% in Sep 2025
Nine Monthly Results Snapshot (Standalone) - Dec'25
Not Applicable: The company has declared_date for only one period
Not Applicable: The company has declared_date for only one period
Annual Results Snapshot (Standalone) - Mar'26
Not Applicable: The company has declared_date for only one period
Not Applicable: The company has declared_date for only one period
About Sugs Lloyd Ltd

Company Coordinates


