
Compare Sukhjit Starch with Similar Stocks
Dashboard
Poor long term growth as Operating profit has grown by an annual rate 2.46% of over the last 5 years
The company has declared positive results in Mar'2026 after 5 consecutive negative quarters
With ROCE of 5.9, it has a Very Attractive valuation with a 1 Enterprise value to Capital Employed
Despite the size of the company, domestic mutual funds hold only 0% of the company
Consistent Underperformance against the benchmark over the last 3 years
Stock DNA
Other Agricultural Products
INR 538 Cr (Micro Cap)
20.00
41
0.58%
0.45
4.76%
0.95
Total Returns (Price + Dividend) 
Latest dividend: 1 per share ex-dividend date: Aug-20-2025
Risk Adjusted Returns v/s
Returns Beta

News

Sukhjit Starch & Chemicals Ltd Downgraded to Hold Amid Mixed Financial and Technical Signals
Sukhjit Starch & Chemicals Ltd has seen its investment rating downgraded from Buy to Hold as of 1 June 2026, reflecting a nuanced shift across key evaluation parameters including financial performance, valuation, technical indicators, and overall quality. Despite a positive quarterly financial turnaround, the company faces challenges in long-term growth and market sentiment, prompting a more cautious stance from analysts.
Read full news article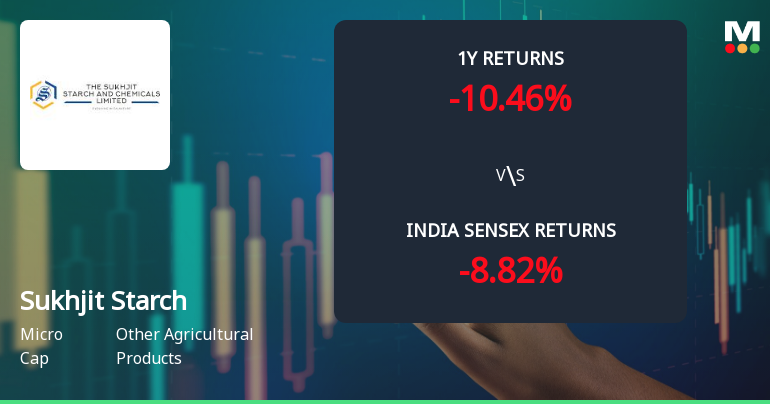
Sukhjit Starch & Chemicals Ltd Sees Technical Momentum Shift Amid Mixed Market Signals
Sukhjit Starch & Chemicals Ltd, a micro-cap player in the Other Agricultural Products sector, has experienced a notable shift in its technical momentum, reflecting a complex interplay of bullish and bearish indicators. Despite a recent downgrade in its Mojo Grade from Buy to Hold, the stock’s technical parameters reveal a nuanced picture of price action and momentum that investors should carefully analyse.
Read full news article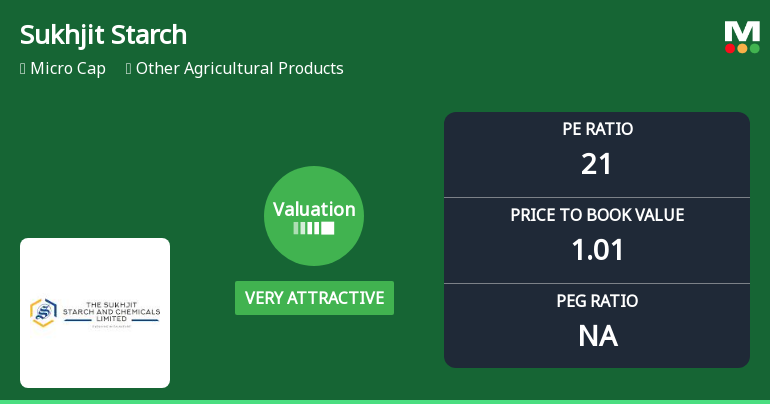
Sukhjit Starch & Chemicals Ltd: Valuation Shifts Signal Renewed Price Attractiveness
Sukhjit Starch & Chemicals Ltd, a micro-cap player in the Other Agricultural Products sector, has seen a significant shift in its valuation parameters, moving from an attractive to a very attractive rating. Despite a recent 9.53% drop in share price, the company’s price-to-earnings (P/E) and price-to-book value (P/BV) ratios now present compelling investment opportunities when compared to both historical averages and peer benchmarks.
Read full news article Announcements
Announcement under Regulation 30 (LODR)-Newspaper Publication
28-May-2026 | Source : BSENewpaper Publication
Announcement under Regulation 30 (LODR)-Press Release / Media Release
28-May-2026 | Source : BSEPress Release
Announcement under Regulation 30 (LODR)-Change in Registered Office Address
27-May-2026 | Source : BSEThe Board has approved to shift the registered office of the company from its present location at Sarai Road Phagwara Distt. Kapurthala-144401 to Rehana Jattan Teh Phagwara Distt. Kapurthala -144407 outside local limits of the city and within same Tehsil /Distt. of the same State of Punjab under the Juridiction of the same Registrar of the Companies.
Corporate Actions

No Upcoming Board Meetings

Sukhjit Starch & Chemicals Ltd has declared 20% dividend, ex-date: 20 Aug 25

Sukhjit Starch & Chemicals Ltd has announced 5:10 stock split, ex-date: 25 Oct 24

Sukhjit Starch & Chemicals Ltd has announced 1:1 bonus issue, ex-date: 27 Mar 19

No Rights history available
Quality key factors
Valuation key factors
Technicals key factors
 Technical Indicator Scale: Bearish, Mildly Bearish, Sideways, Mildly Bullish, Bullish Turned
 Shareholding Snapshot : Mar 2026
Shareholding Compare (%holding)
Promoters
None
Held by 0 Schemes
Held by 1 FIIs (0.0%)
Bhavdeep Sardana (8.06%)
None
26.34%
Quarterly Results Snapshot (Consolidated) - Mar'26 - QoQ

QoQ Growth in quarter ended Mar 2026 is 15.76% vs 10.30% in Dec 2025
QoQ Growth in quarter ended Mar 2026 is 366.13% vs -27.21% in Dec 2025
Half Yearly Results Snapshot (Consolidated) - Sep'25

Growth in half year ended Sep 2025 is -10.38% vs 18.46% in Sep 2024
Growth in half year ended Sep 2025 is -64.69% vs 19.54% in Sep 2024
Nine Monthly Results Snapshot (Consolidated) - Dec'25
YoY Growth in nine months ended Dec 2025 is -9.44% vs 13.21% in Dec 2024
YoY Growth in nine months ended Dec 2025 is -66.51% vs -2.44% in Dec 2024
Annual Results Snapshot (Consolidated) - Mar'26
YoY Growth in year ended Mar 2026 is -4.37% vs 8.91% in Mar 2025
YoY Growth in year ended Mar 2026 is -32.37% vs -20.04% in Mar 2025
About Sukhjit Starch & Chemicals Ltd

Company Coordinates


