
Compare Sulabh Engineers with Similar Stocks
Stock DNA
Non Banking Financial Company (NBFC)
INR 31 Cr (Micro Cap)
18.00
21
0.00%
0.00
3.80%
0.83
Total Returns (Price + Dividend) 
Sulabh Engineers for the last several years.
Risk Adjusted Returns v/s
Returns Beta

News
Are Sulabh Engineers & Services Ltd latest results good or bad?
Sulabh Engineers & Services Ltd's latest financial results for Q1 FY27 indicate a notable recovery in both net sales and net profit compared to the previous year. The company reported consolidated net sales of ₹1.82 crores, reflecting an 85.71% year-on-year growth from ₹0.98 crores in Q1 FY26. Additionally, the consolidated net profit reached ₹0.92 crores, marking a 50.82% increase from ₹0.61 crores in the same quarter last year. The operating profit margin for the quarter stood at 67.03%, a significant improvement from the previous quarter's negative margin. This recovery in margins, along with controlled interest expenses, contributed to the return to profitability after a loss in the prior quarter. However, the company has exhibited a pattern of volatility in its financial performance, with previous quarters showing inconsistent results, including a revenue decline of 47.86% in Q3 FY26. Despite the pos...
Read full news article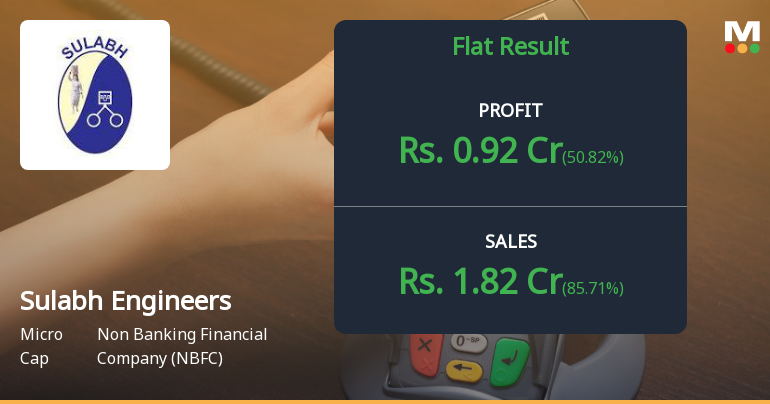
Sulabh Engineers Q1 FY27: Profit Surge Masks Deeper Concerns in Micro-Cap NBFC
Sulabh Engineers & Services Ltd., a Mumbai-based micro-cap non-banking financial company, reported a consolidated net profit of ₹0.92 crores for Q1 FY27, marking a 50.82% year-on-year increase from ₹0.61 crores in Q1 FY26. However, the sequential comparison reveals significant volatility, with profits recovering sharply from a loss of ₹0.96 crores in Q4 FY26. The stock, trading at ₹2.90 with a market capitalisation of just ₹29.14 crores, declined 2.03% following the results, reflecting investor scepticism about the sustainability of this turnaround in a company plagued by erratic performance and weak fundamental metrics.
Read full news articleAre Sulabh Engineers & Services Ltd latest results good or bad?
The latest financial results for Sulabh Engineers & Services Ltd indicate a challenging operational environment, particularly in the fourth quarter of FY26. The company reported a net profit of negative ₹0.96 crores, reflecting a significant decline compared to the previous quarter and the same quarter last year. This negative performance is coupled with an operating profit (PBDIT excluding other income) that fell to negative ₹1.43 crores, marking a substantial reversal from a positive operating profit in the prior quarter. Despite a year-on-year increase in net sales of 42.50%, reaching ₹1.14 crores, this revenue growth was insufficient to counterbalance the operational challenges faced during the period. The operating margin deteriorated sharply to negative 125.44%, highlighting severe issues in the company's core lending operations. The return on equity for the latest period stood at 6.66%, which, while...
Read full news article Announcements
Announcement under Regulation 30 (LODR)-Newspaper Publication
15-Jul-2026 | Source : BSENewspaper Publication for the financial results for the quarter ended on 30.06.2026.
Financial Results For The Quarter Ended On 30.06.2026
14-Jul-2026 | Source : BSEFinancial Results for the quarter ended on 30.06.2026
Board Meeting Outcome for Outcome Of Board Meeting Held On 14.07.2026
14-Jul-2026 | Source : BSEOutcome of Board Meeting Held on 14.07.2026
Corporate Actions

No Upcoming Board Meetings

Sulabh Engineers & Services Ltd has declared 6% dividend, ex-date: 29 Jun 10

Sulabh Engineers & Services Ltd has announced 1:10 stock split, ex-date: 04 Feb 13

No Bonus history available

No Rights history available
Quality key factors
Valuation key factors
Technicals key factors
 Technical Indicator Scale: Bearish, Mildly Bearish, Sideways, Mildly Bullish, Bullish Turned
 Shareholding Snapshot : Jun 2026
Shareholding Compare (%holding)
Non Institution
None
Held by 0 Schemes
Held by 0 FIIs
Ruchi Agarwal (5.79%)
Som Prakash Goenka (3.87%)
54.58%
Quarterly Results Snapshot (Consolidated) - Jun'26 - YoY

YoY Growth in quarter ended Jun 2026 is 85.71% vs -39.51% in Jun 2025
YoY Growth in quarter ended Jun 2026 is 50.82% vs 48.78% in Jun 2025
Half Yearly Results Snapshot (Consolidated) - Sep'25

Growth in half year ended Sep 2025 is -37.68% vs 11.29% in Sep 2024
Growth in half year ended Sep 2025 is 110.53% vs 83.87% in Sep 2024
Nine Monthly Results Snapshot (Consolidated) - Dec'25
YoY Growth in nine months ended Dec 2025 is -33.49% vs -20.19% in Dec 2024
YoY Growth in nine months ended Dec 2025 is 68.35% vs 117.19% in Dec 2024
Annual Results Snapshot (Consolidated) - Mar'26
YoY Growth in year ended Mar 2026 is -21.21% vs 56.65% in Mar 2025
YoY Growth in year ended Mar 2026 is -64.63% vs 73.24% in Mar 2025
About Sulabh Engineers & Services Ltd

Company Coordinates


