
Compare Sumit Woods with Similar Stocks
Dashboard
Weak Long Term Fundamental Strength with an average Return on Capital Employed (ROCE) of 9.32%
- Low ability to service debt as the company has a high Debt to EBITDA ratio of 7.17 times
The company has declared Negative results for the last 3 consecutive quarters
Below par performance in long term as well as near term
Total Returns (Price + Dividend) 
Sumit Woods for the last several years.
Risk Adjusted Returns v/s
Returns Beta

News
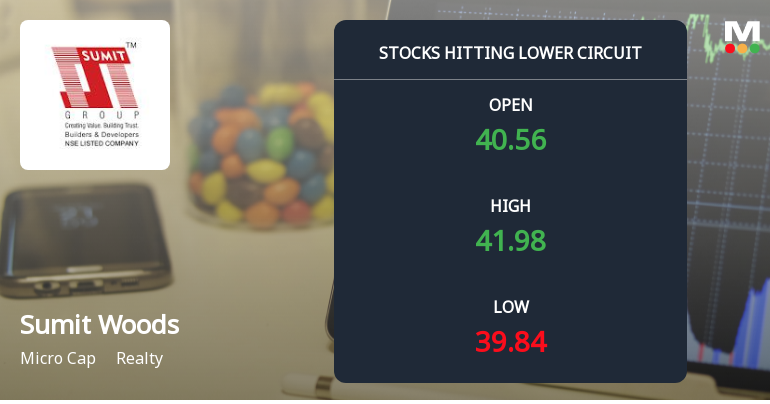
Sumit Woods Ltd Locks at Lower Circuit With 4.98% Loss — Sellers Queue, No Buyers in Sight
At Rs 39.84, sellers were still queuing — but there were no buyers willing to take the other side. Sumit Woods Ltd locked at its lower circuit of 4.98% on 11 Jun 2026, with unfilled sell orders and a frozen price, reflecting a day where supply overwhelmed demand to the point where the circuit breaker intervened.
Read full news article
Sumit Woods Ltd Locks at Lower Circuit With 4.98% Loss — Sellers Queue, No Buyers in Sight
At Rs 41.01, sellers were still queuing — but there were no buyers willing to take the other side. Sumit Woods Ltd locked at its lower circuit of 4.98% on 4 Jun 2026, with unfilled sell orders and a frozen price, reflecting persistent selling pressure in a micro-cap stock with limited liquidity.
Read full news article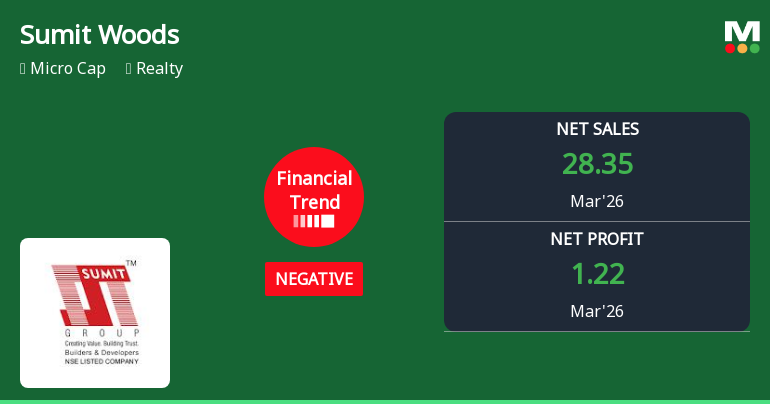
Sumit Woods Ltd Reports Marginal Financial Improvement Amid Persistent Challenges
Sumit Woods Ltd, a micro-cap player in the Realty sector, has reported its quarterly financial results for March 2026, revealing a modest improvement in its financial trend despite persistent challenges. The company’s financial performance remains negative, but the recent quarter shows a slight easing from very negative to negative territory, signalling cautious optimism amid a tough operating environment.
Read full news article Announcements
Sumit Woods Limited - Updates
04-Nov-2019 | Source : NSESumit Woods Limited has informed the Exchange regarding 'Compliance with Indian Accounting Standards notified vide MCA circular dated 16/02/2015 read with SEBI circulars dated 05/07/2016'.
Sumit Woods Limited - Other General Purpose
01-Nov-2019 | Source : NSESumit Woods Limited has informed the Exchange regarding Submission of half yearly Disclosure on Related Party Transactions
Updates
03-Sep-2019 | Source : NSE
| Sumit Woods Limited has informed the Exchange regarding 'Launch for project Arcenciel- Mulund (W).'. |
Corporate Actions

No Upcoming Board Meetings

No Dividend history available

No Splits history available

Sumit Woods Ltd has announced 1:1 bonus issue, ex-date: 16 Jul 19

No Rights history available
Quality key factors
Valuation key factors
Technicals key factors
 Technical Indicator Scale: Bearish, Mildly Bearish, Sideways, Mildly Bullish, Bullish Turned
 Shareholding Snapshot : Mar 2026
Shareholding Compare (%holding)
Promoters
None
Held by 0 Schemes
Held by 2 FIIs (0.27%)
Mitaram Ramlal Jangid (22.31%)
Shankar Sharma (7.31%)
27.03%
Quarterly Results Snapshot (Consolidated) - Mar'26 - QoQ

QoQ Growth in quarter ended Mar 2026 is 147.81% vs -10.76% in Dec 2025

QoQ Growth in quarter ended Mar 2026 is 9.91% vs 282.76% in Dec 2025
Half Yearly Results Snapshot (Consolidated) - Sep'25
Growth in half year ended Sep 2025 is -29.46% vs 8.16% in Sep 2024
Growth in half year ended Sep 2025 is -3.63% vs 73.87% in Sep 2024
Nine Monthly Results Snapshot (Consolidated) - Dec'25
YoY Growth in nine months ended Dec 2025 is -38.35% vs -6.21% in Dec 2024
YoY Growth in nine months ended Dec 2025 is -28.23% vs 74.35% in Dec 2024
Annual Results Snapshot (Consolidated) - Mar'26
YoY Growth in year ended Mar 2026 is -32.63% vs -21.96% in Mar 2025
YoY Growth in year ended Mar 2026 is -47.03% vs 27.25% in Mar 2025
About Sumit Woods Ltd

Company Coordinates


