
Compare Sumitomo Chemi. with Similar Stocks
Dashboard
Poor long term growth as Net Sales has grown by an annual rate of 4.13% and Operating profit at 6.55% over the last 5 years
Negative results in Mar 26
With ROE of 16.4, it has a Very Expensive valuation with a 6.5 Price to Book Value
Consistent Underperformance against the benchmark over the last 3 years
Stock DNA
Pesticides & Agrochemicals
INR 22,579 Cr (Small Cap)
40.00
43
0.27%
-0.28
16.37%
6.66
Total Returns (Price + Dividend) 
Latest dividend: 1.2 per share ex-dividend date: Jul-25-2025
Risk Adjusted Returns v/s
Returns Beta

News

Sumitomo Chemical India Ltd is Rated Sell
Sumitomo Chemical India Ltd is rated 'Sell' by MarketsMOJO, with this rating last updated on 06 April 2026. However, all fundamentals, returns, and financial metrics discussed here reflect the stock's current position as of 12 June 2026, providing investors with an up-to-date analysis of the company’s performance and outlook.
Read full news article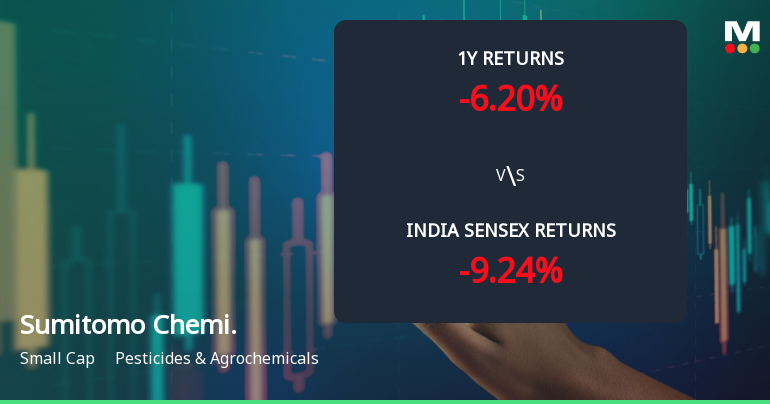
Sumitomo Chemical India Ltd Technical Momentum Shifts Amid Mixed Indicator Signals
Sumitomo Chemical India Ltd, a small-cap player in the Pesticides & Agrochemicals sector, has experienced a notable shift in its technical momentum, moving from a sideways trend to a mildly bearish stance. Despite some bullish weekly indicators, monthly signals suggest caution, reflecting a complex technical landscape for investors to navigate.
Read full news article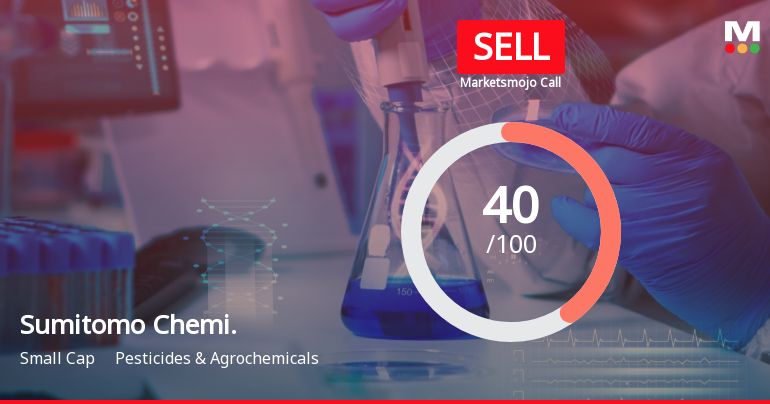
Sumitomo Chemical India Ltd is Rated Sell
Sumitomo Chemical India Ltd is rated 'Sell' by MarketsMOJO, with this rating last updated on 06 April 2026. However, all fundamentals, returns, and financial metrics discussed here reflect the stock's current position as of 01 June 2026, providing investors with an up-to-date assessment of the company’s standing.
Read full news article Announcements
Record Date For Ascertaining Eligibility Of Shareholders For Payment Of Dividend For F.Y. 2025-26.
17-Jun-2026 | Source : BSERecord date for ascertaining eligibility of shareholders for payment of Dividend for F.Y. 2025-26.
Integrated Filing (Financial) For The Quarter And Year Ended 31St March 2026.
11-Jun-2026 | Source : BSEIntegrated Filing (Financial) for the quarter and year ended 31st March 2026.
Announcement under Regulation 30 (LODR)-Earnings Call Transcript
04-Jun-2026 | Source : BSEWritten transcript of earnings call held on 28th May 2026
Corporate Actions

No Upcoming Board Meetings

Sumitomo Chemical India Ltd has declared 13% dividend, ex-date: 17 Jul 26

No Splits history available

No Bonus history available

No Rights history available
Quality key factors
Valuation key factors
Technicals key factors
 Technical Indicator Scale: Bearish, Mildly Bearish, Sideways, Mildly Bullish, Bullish Turned
 Shareholding Snapshot : Mar 2026
Shareholding Compare (%holding)
Promoters
None
Held by 30 Schemes (6.88%)
Held by 110 FIIs (3.4%)
Sumitomo Chemical Company Limited (75.0%)
Aditya Birla Sun Life Trustee Private Limited A/c - Aditya Birla Sun Life Elss Tax Saver Fund (1.42%)
9.66%
Quarterly Results Snapshot (Consolidated) - Mar'26 - QoQ

QoQ Growth in quarter ended Mar 2026 is 20.38% vs -38.92% in Dec 2025
QoQ Growth in quarter ended Mar 2026 is 47.07% vs -57.46% in Dec 2025
Half Yearly Results Snapshot (Consolidated) - Sep'25

Growth in half year ended Sep 2025 is 8.72% vs 12.25% in Sep 2024
Growth in half year ended Sep 2025 is 11.64% vs 55.50% in Sep 2024
Nine Monthly Results Snapshot (Consolidated) - Dec'25
YoY Growth in nine months ended Dec 2025 is 3.46% vs 13.80% in Dec 2024
YoY Growth in nine months ended Dec 2025 is 6.36% vs 56.22% in Dec 2024
Annual Results Snapshot (Consolidated) - Mar'26
YoY Growth in year ended Mar 2026 is 2.85% vs 10.71% in Mar 2025
YoY Growth in year ended Mar 2026 is 7.41% vs 36.79% in Mar 2025
About Sumitomo Chemical India Ltd

Company Coordinates


