
Compare Sunrakshakk Inds with Similar Stocks
Dashboard
Strong ability to service debt as the company has a low Debt to EBITDA ratio of 0.81 times
Healthy long term growth as Net Sales has grown by an annual rate of 127.70% and Operating profit at 92.78%
With a growth in Operating Profit of 29.05%, the company declared Outstanding results in Mar 26
With ROCE of 20.7, it has a Fair valuation with a 4.8 Enterprise value to Capital Employed
Consistent Returns over the last 3 years
Stock DNA
Garments & Apparels
INR 992 Cr (Micro Cap)
29.00
23
0.00%
0.17
18.91%
5.39
Total Returns (Price + Dividend) 
Sunrakshakk Inds for the last several years.
Risk Adjusted Returns v/s
Returns Beta

News
Are Sunrakshakk Industries India Ltd latest results good or bad?
Sunrakshakk Industries India Ltd has reported notable financial results for the fourth quarter of FY26, reflecting a significant transformation in its operational performance. The company achieved net sales of ₹197.59 crores, marking a substantial year-on-year increase of 92.32% from ₹102.74 crores in Q4 FY25, and a sequential growth of 20.52% from ₹163.95 crores in Q3 FY26. This quarter represents the highest-ever sales figure for the company, indicating strong demand and improved market positioning. Net profit for Q4 FY26 reached ₹12.10 crores, which is an 87.89% increase compared to ₹6.44 crores in the same quarter last year, alongside a sequential profit growth of 28.59% from ₹9.41 crores in Q3 FY26. The profit after tax (PAT) margin for this quarter stood at 6.12%, slightly lower than the 6.27% recorded in Q4 FY25, yet stable above 6%, demonstrating the company's ability to maintain profitability amid...
Read full news article
Sunrakshakk Industries India Ltd Upgraded to Strong Buy on Improved Valuation and Financials
Sunrakshakk Industries India Ltd, a micro-cap player in the Garments & Apparels sector, has seen its investment rating upgraded from Buy to Strong Buy as of 1 June 2026. This upgrade reflects significant improvements across valuation, financial trends, quality metrics, and technical indicators, positioning the stock favourably amid a challenging market backdrop.
Read full news article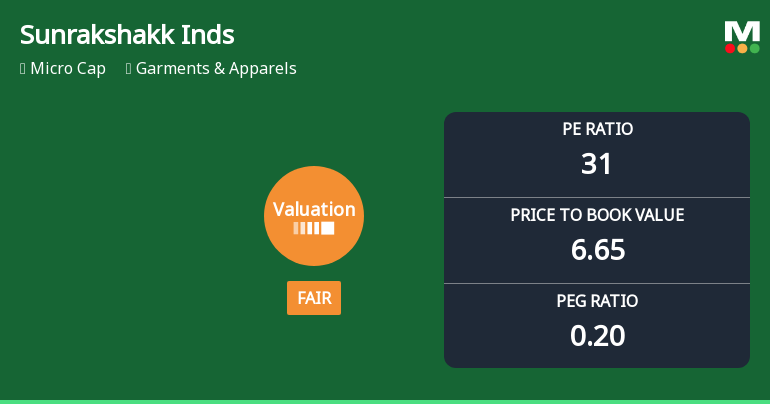
Sunrakshakk Industries India Ltd: Valuation Shift Enhances Price Attractiveness Amid Robust Returns
Sunrakshakk Industries India Ltd, a micro-cap player in the Garments & Apparels sector, has witnessed a significant shift in its valuation parameters, moving from a very expensive to a fair valuation grade. This change, coupled with robust returns over multiple time horizons, highlights a renewed price attractiveness that investors should carefully consider amid the current market backdrop.
Read full news article Announcements
Announcement under Regulation 30 (LODR)-Earnings Call Transcript
06-Jun-2026 | Source : BSEPursuant to Regulation 30 and 46 of SEBI (LODR) Regulations2015 with reference to our result press conference intimation dated 29th May 2026 please be informed that result press conference call for Q4 and FY 26 was hosted on 3rd June 26 and the transcript of the conference call is enclosed for your reference and record
Disclosure Under Regulation 30 Of The SEBI (Listing Obligations And Disclosure Requirements) Regulations 2015 - Audio Recording Of Earnings Call Q4
03-Jun-2026 | Source : BSEPursuant to Regulation 30 read with Para III of SEBI (LODR) regulation 2015 please find Audio Recording of Earnings Call Of Q4 FY 26
Schedule Of Earning Concall Of Q4 & FY26 With Analysts And Investors On Wednesday June 03 2026
03-Jun-2026 | Source : BSEConcall Link for Q4 FY 26
Corporate Actions

No Upcoming Board Meetings

No Dividend history available

Sunrakshakk Industries India Ltd has announced 2:10 stock split, ex-date: 17 Oct 25

No Bonus history available

No Rights history available
Quality key factors
Valuation key factors
Technicals key factors
 Technical Indicator Scale: Bearish, Mildly Bearish, Sideways, Mildly Bullish, Bullish Turned
 Shareholding Snapshot : Mar 2026
Shareholding Compare (%holding)
Promoters
None
Held by 0 Schemes
Held by 0 FIIs
Fshion Suiting Pvt Ltd (43.96%)
Authum Investment And Infrastructure Limited (3.95%)
19.96%
Quarterly Results Snapshot (Consolidated) - Mar'26 - QoQ

QoQ Growth in quarter ended Mar 2026 is 20.52% vs 35.53% in Dec 2025
QoQ Growth in quarter ended Mar 2026 is 28.59% vs 35.40% in Dec 2025
Half Yearly Results Snapshot (Standalone) - Sep'25

Growth in half year ended Sep 2025 is 8.69% vs -12.71% in Sep 2024
Growth in half year ended Sep 2025 is 28.81% vs -39.49% in Sep 2024
Nine Monthly Results Snapshot (Standalone) - Dec'25
YoY Growth in nine months ended Dec 2025 is 38.09% vs -10.70% in Dec 2024
YoY Growth in nine months ended Dec 2025 is 37.06% vs -31.43% in Dec 2024
Annual Results Snapshot (Consolidated) - Mar'26
YoY Growth in year ended Mar 2026 is 237.34% vs 53.67% in Mar 2025
YoY Growth in year ended Mar 2026 is 217.71% vs 30.30% in Mar 2025
About Sunrakshakk Industries India Ltd

Company Coordinates


