
Compare Surya Roshni with Similar Stocks
Dashboard
Poor long term growth as Net Sales has grown by an annual rate of 6.28% and Operating profit at 5.26% over the last 5 years
Flat results in Mar 26
With ROE of 10.9, it has a Very Expensive valuation with a 2 Price to Book Value
Falling Participation by Institutional Investors
Underperformed the market in the last 1 year
Stock DNA
Iron & Steel Products
INR 5,261 Cr (Small Cap)
19.00
26
2.22%
-0.14
10.85%
2.05
Total Returns (Price + Dividend) 
Latest dividend: 2.500916590284143 per share ex-dividend date: Nov-17-2025
Risk Adjusted Returns v/s
Returns Beta

News

Surya Roshni Ltd is Rated Sell
Surya Roshni Ltd is rated 'Sell' by MarketsMOJO, with this rating last updated on 17 Nov 2025. However, the analysis and financial metrics discussed here reflect the stock's current position as of 17 July 2026, providing investors with an up-to-date view of the company’s fundamentals, valuation, financial trends, and technical outlook.
Read full news article
Surya Roshni Ltd is Rated Sell
Surya Roshni Ltd is rated 'Sell' by MarketsMOJO, with this rating last updated on 17 Nov 2025. However, the analysis and financial metrics discussed here reflect the stock's current position as of 06 July 2026, providing investors with an up-to-date perspective on the company’s fundamentals, valuation, financial trends, and technical outlook.
Read full news article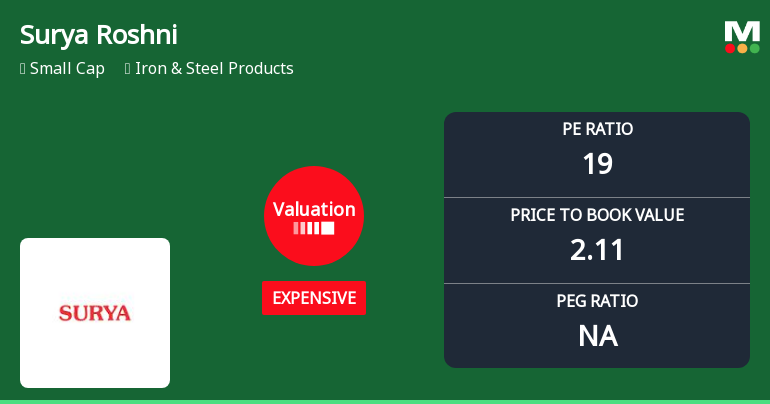
Surya Roshni Ltd Valuation Shifts Signal Price Attractiveness Change Amid Sector Dynamics
Surya Roshni Ltd, a key player in the Iron & Steel Products sector, has experienced a notable shift in its valuation parameters, moving from a 'very expensive' to an 'expensive' rating. This change reflects evolving market perceptions amid fluctuating price-to-earnings (P/E) and price-to-book value (P/BV) ratios, prompting investors to reassess the stock’s price attractiveness relative to its historical and peer benchmarks.
Read full news article Announcements
Surya Roshni Limited - Other General Purpose
26-Nov-2019 | Source : NSESurya Roshni Limited has submitted to the Exchange a copy of Disclosure of Related Party Transactions under Regulation 23(9) of SEBI (Listing Obligations and Disclosure Requirements) Regulations, 2015 for the half year ended September 30, 2019.
Surya Roshni Limited - Investor Presentation
18-Nov-2019 | Source : NSESurya Roshni Limited has informed the Exchange regarding Investor Presentation-November, 2019
Surya Roshni Limited - Press Release
15-Nov-2019 | Source : NSESurya Roshni Limited has informed the Exchange regarding a press release dated November 14, 2019, titled "THE COMPANY ANNOUNCES UN-AUDITED FINANCIAL RESULTS FOR THE QUARTER/
Corporate Actions

No Upcoming Board Meetings

Surya Roshni Ltd has declared 50% dividend, ex-date: 17 Nov 25

Surya Roshni Ltd has announced 5:10 stock split, ex-date: 06 Oct 23

Surya Roshni Ltd has announced 1:1 bonus issue, ex-date: 01 Jan 25

No Rights history available
Quality key factors
Valuation key factors
Technicals key factors
 Technical Indicator Scale: Bearish, Mildly Bearish, Sideways, Mildly Bullish, Bullish Turned
 Shareholding Snapshot : Jun 2026
Shareholding Compare (%holding)
Promoters
None
Held by 7 Schemes (0.19%)
Held by 78 FIIs (3.81%)
Diwakar Marketing Private Limited (10.55%)
Henco Commercials Private Limited (2.36%)
21.3%
Quarterly Results Snapshot (Consolidated) - Mar'26 - QoQ

QoQ Growth in quarter ended Mar 2026 is 12.23% vs 4.46% in Dec 2025
QoQ Growth in quarter ended Mar 2026 is 23.35% vs 7.41% in Dec 2025
Half Yearly Results Snapshot (Consolidated) - Sep'25
Growth in half year ended Sep 2025 is 0.81% vs -9.73% in Sep 2024

Growth in half year ended Sep 2025 is -14.84% vs -6.31% in Sep 2024
Nine Monthly Results Snapshot (Consolidated) - Dec'25
YoY Growth in nine months ended Dec 2025 is 1.65% vs -7.66% in Dec 2024
YoY Growth in nine months ended Dec 2025 is -13.39% vs -3.88% in Dec 2024
Annual Results Snapshot (Consolidated) - Mar'26
YoY Growth in year ended Mar 2026 is 1.41% vs -4.78% in Mar 2025
YoY Growth in year ended Mar 2026 is -17.54% vs 5.30% in Mar 2025
About Surya Roshni Ltd

Company Coordinates


