
Compare Suven Life Scie. with Similar Stocks
Dashboard
With a Operating Losses, the company has a Weak Long Term Fundamental Strength
- Poor long term growth as Net Sales has grown by an annual rate of -11.98% and Operating profit at -207.58% over the last 5 years
- Company's ability to service its debt is weak with a poor EBIT to Interest (avg) ratio of -171.09
Flat results in Mar 26
Risky - Negative EBITDA
Stock DNA
Healthcare Services
INR 8,944 Cr (Small Cap)
NA (Loss Making)
35
0.00%
-0.85
-46.73%
14.17
Total Returns (Price + Dividend) 
Latest dividend: 0.10500000000000001 per share ex-dividend date: Feb-14-2019
Risk Adjusted Returns v/s
Returns Beta

News
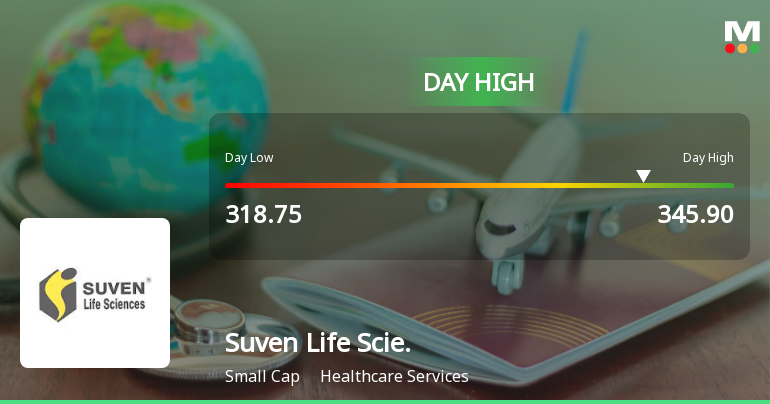
Suven Life Sciences Ltd Surges 7.15% to Day's High of Rs 345.9 — Outperforms Sector by 5.14 Percentage Points
The Sensex rose 0.61% on 09 Jul 2026, yet Suven Life Sciences Ltd outpaced the broader market with a 7.15% gain, touching an intraday high of Rs 345.9. This 5.14-percentage-point outperformance over its Healthcare Services sector peers signals a distinctly stock-specific rally rather than a market-wide lift.
Read full news article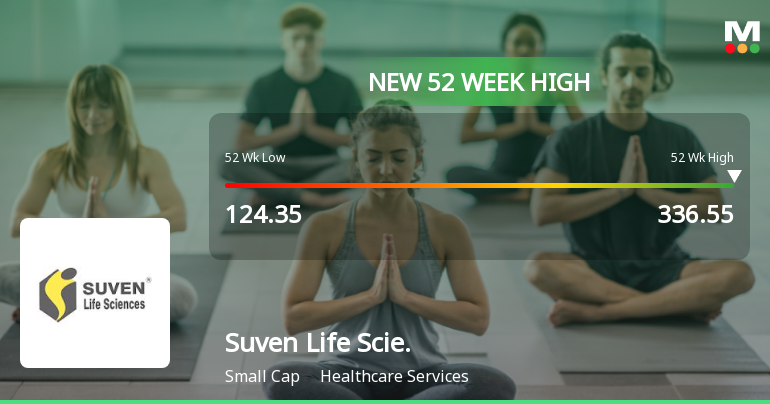
Broad-Based Technical Strength Lifts Suven Life Sciences Ltd to 52-Week High of Rs 345.9
Surging to an intraday peak of Rs 345.9 on 9 Jul 2026, Suven Life Sciences Ltd has marked a significant milestone by reaching a fresh 52-week high. This achievement comes amid a backdrop of robust technical momentum and sustained outperformance relative to its sector and the broader market.
Read full news article
Announcements
Closure of Trading Window
26-Jun-2026 | Source : BSEClosure of Trading Window
Announcement under Regulation 30 (LODR)-Press Release / Media Release
22-Jun-2026 | Source : BSEPlease find enclosed News release of our company
Announcement under Regulation 30 (LODR)-Allotment of ESOP / ESPS
22-Jun-2026 | Source : BSEAllotment of 271970 Equity shares upon exercise of vested options under SLSL ESOP 2020 Scheme
Corporate Actions

No Upcoming Board Meetings

Suven Life Sciences Ltd has declared 150% dividend, ex-date: 14 Feb 19

Suven Life Sciences Ltd has announced 1:2 stock split, ex-date: 23 Mar 07

Suven Life Sciences Ltd has announced 1:1 bonus issue, ex-date: 23 Mar 07

Suven Life Sciences Ltd has announced 1:2 rights issue, ex-date: 17 Oct 22
Quality key factors
Valuation key factors
Technicals key factors
 Technical Indicator Scale: Bearish, Mildly Bearish, Sideways, Mildly Bullish, Bullish Turned
 Shareholding Snapshot : Mar 2026
Shareholding Compare (%holding)
Promoters
None
Held by 4 Schemes (1.79%)
Held by 12 FIIs (0.91%)
Jasti Property And Equity Holdings Private Limited (in Its Capacity As Sole Trustee Of Jasti Family (69.57%)
Quant Mutual Fund - Quant Small Cap Fund (1.78%)
19.45%
Quarterly Results Snapshot (Consolidated) - Mar'26 - QoQ

QoQ Growth in quarter ended Mar 2026 is -45.91% vs 205.43% in Dec 2025

QoQ Growth in quarter ended Mar 2026 is 55.26% vs -31.83% in Dec 2025
Half Yearly Results Snapshot (Consolidated) - Sep'25
Growth in half year ended Sep 2025 is -22.07% vs -47.81% in Sep 2024
Growth in half year ended Sep 2025 is -65.85% vs -111.26% in Sep 2024
Nine Monthly Results Snapshot (Consolidated) - Dec'25
YoY Growth in nine months ended Dec 2025 is 7.90% vs -44.25% in Dec 2024
YoY Growth in nine months ended Dec 2025 is -97.56% vs -48.73% in Dec 2024
Annual Results Snapshot (Consolidated) - Mar'26
YoY Growth in year ended Mar 2026 is 6.76% vs -43.03% in Mar 2025
YoY Growth in year ended Mar 2026 is -71.91% vs -52.98% in Mar 2025
About Suven Life Sciences Ltd

Company Coordinates


