
Compare Suzlon Energy with Similar Stocks
Stock DNA
Heavy Electrical Equipment
INR 79,273 Cr (Mid Cap)
25.00
32
0.00%
-0.10
33.43%
8.38
Total Returns (Price + Dividend) 
Latest dividend: 0.9174 per share ex-dividend date: Jul-17-2008
Risk Adjusted Returns v/s
Returns Beta

News

Suzlon Energy Ltd Sees Exceptional Volume Amid Mixed Price Action
Suzlon Energy Ltd, a mid-cap player in the Heavy Electrical Equipment sector, has emerged as one of the most actively traded stocks by volume on 24 June 2026. Despite a slight dip in price, the stock’s trading activity surged significantly, signalling notable investor interest and potential accumulation signals amid a mixed technical backdrop.
Read full news article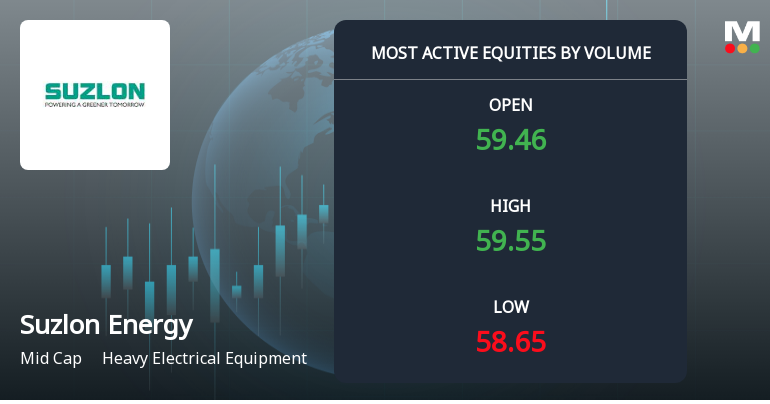
Suzlon Energy Ltd Sees Exceptional Volume Amid Mixed Price Action
Suzlon Energy Ltd (SUZLON), a mid-cap player in the Heavy Electrical Equipment sector, witnessed one of the highest trading volumes on 23 June 2026, with over 1.24 crore shares exchanging hands. Despite this surge in activity, the stock price edged slightly lower by 0.81%, reflecting a complex interplay of investor sentiment and market dynamics.
Read full news article
Suzlon Energy Ltd Sees Exceptional Volume Surge Amid Positive Momentum
Suzlon Energy Ltd (SUZLON), a prominent player in the Heavy Electrical Equipment sector, has witnessed a remarkable surge in trading volume, reflecting heightened investor interest following a recent upgrade in its Mojo Grade to 'Buy'. The stock’s robust activity, coupled with positive technical signals and rising delivery volumes, underscores a potential accumulation phase that market participants are closely monitoring.
Read full news article Announcements
Rumour verification - Regulation 30(11)
16-Jun-2026 | Source : BSERumour verification - Regulation 30(11)
Announcement under Regulation 30 (LODR)-Investor Presentation
12-Jun-2026 | Source : BSEInvestors Meet - Presentation
Announcement under Regulation 30 (LODR)-Analyst / Investor Meet - Intimation
09-Jun-2026 | Source : BSEInvestors Meet
Corporate Actions

No Upcoming Board Meetings

Suzlon Energy Ltd has declared 50% dividend, ex-date: 17 Jul 08

Suzlon Energy Ltd has announced 2:10 stock split, ex-date: 21 Jan 08

No Bonus history available

Suzlon Energy Ltd has announced 5:21 rights issue, ex-date: 03 Oct 22
Quality key factors
Valuation key factors
Technicals key factors
 Technical Indicator Scale: Bearish, Mildly Bearish, Sideways, Mildly Bullish, Bullish Turned
 Shareholding Snapshot : Mar 2026
Shareholding Compare (%holding)
Non Institution
None
Held by 30 Schemes (4.87%)
Held by 678 FIIs (23.85%)
Tanti Holdings Private Limited (4.63%)
Belgrave Investment Fund . (1.86%)
39.11%
Quarterly Results Snapshot (Consolidated) - Mar'26 - QoQ

QoQ Growth in quarter ended Mar 2026 is 29.68% vs 9.44% in Dec 2025
QoQ Growth in quarter ended Mar 2026 is 150.26% vs -65.20% in Dec 2025
Half Yearly Results Snapshot (Consolidated) - Sep'25
Growth in half year ended Sep 2025 is 69.76% vs 48.79% in Sep 2024
Growth in half year ended Sep 2025 is 219.16% vs 147.30% in Sep 2024
Nine Monthly Results Snapshot (Consolidated) - Dec'25

YoY Growth in nine months ended Dec 2025 is 58.29% vs 63.86% in Dec 2024
YoY Growth in nine months ended Dec 2025 is 130.38% vs 118.94% in Dec 2024
Annual Results Snapshot (Consolidated) - Mar'26
YoY Growth in year ended Mar 2026 is 53.65% vs 66.79% in Mar 2025
YoY Growth in year ended Mar 2026 is 52.70% vs 213.72% in Mar 2025
About Suzlon Energy Ltd

Company Coordinates


