
Compare Swasti Vin. Art with Similar Stocks
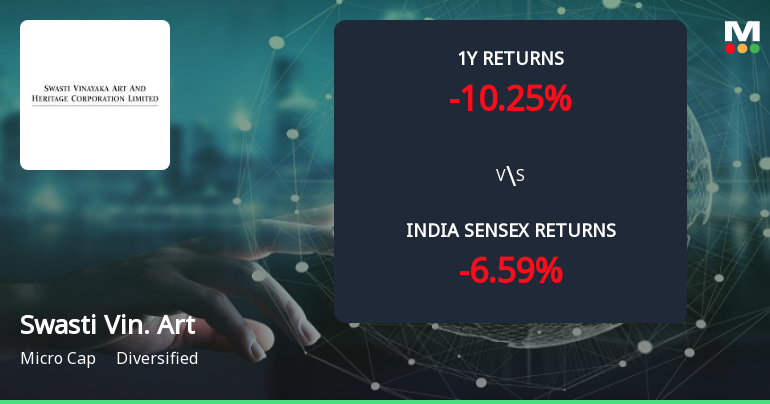
Total Returns (Price + Dividend) 
Latest dividend: 0.088 per share ex-dividend date: Sep-19-2019
Risk Adjusted Returns v/s
Returns Beta

News
Golden Cross Forms in Swasti Vinayaka Art & Heritage Corporation Ltd — Mixed Technical Signals Cloud the Outlook
The 50-day moving average has crossed above the 200-day moving average for Swasti Vinayaka Art & Heritage Corporation Ltd, signalling a golden cross on 16 Jul 2026. Yet, the broader technical picture is conflicted, with monthly indicators largely bearish and recent price performance subdued, raising questions about the signal’s reliability.
Read full news article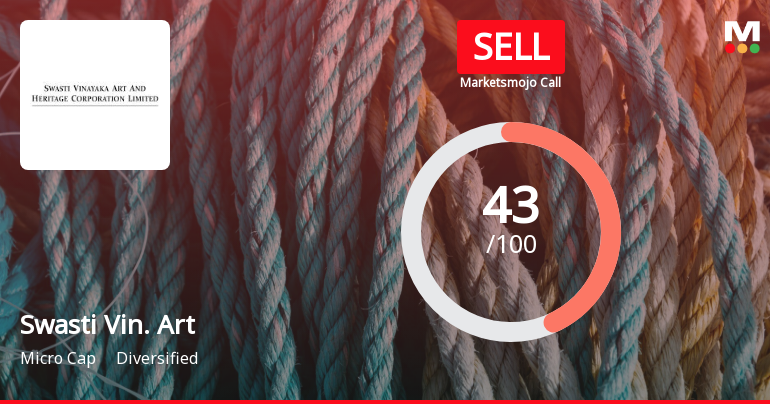
Swasti Vinayaka Art & Heritage Corporation Ltd is Rated Sell
Swasti Vinayaka Art & Heritage Corporation Ltd is rated 'Sell' by MarketsMOJO. This rating was last updated on 14 Aug 2025. However, the analysis and financial metrics discussed below reflect the stock's current position as of 03 July 2026, providing investors with the latest insights into the company’s performance and outlook.
Read full news article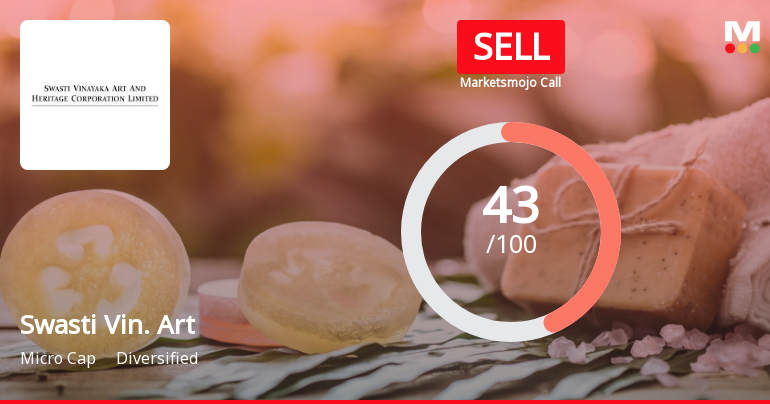
Swasti Vinayaka Art & Heritage Corporation Ltd is Rated Sell
Swasti Vinayaka Art & Heritage Corporation Ltd is rated Sell by MarketsMOJO. This rating was last updated on 14 August 2025, reflecting a shift from a previous Strong Sell to the current Sell status. However, all fundamentals, returns, and financial metrics discussed here are based on the company’s position as of 19 June 2026, providing investors with the most up-to-date analysis.
Read full news article Announcements
Compliances-Certificate under Reg. 74 (5) of SEBI (DP) Regulations 2018
08-Jul-2026 | Source : BSEWe are enclosing herewith the certificate dated July 07 2026 issues by Bigshare Services Pvt. Ltd. Registrar and Share Transfer Agent (RTA) of the Company confirming the compliance of Regulation 74(5) of the Securities and Exchange Board of India (Depositories and Participants) Regulations 2018 for the Quarter ended June 30 2026
Closure of Trading Window
25-Jun-2026 | Source : BSEPursuant to SEBI (Prohibition of Insider Trading) Regulations 2015 the Trading Window for dealing in Equity Shares of the Company shall remain closed for all Designated Persons and their Immediate Relatives with effect from Wednesday July 01 2026 till the conclusion of 48 Hours after the declaration of Un-audited Financial Results for the Quarter ended on June 30 2026.
Resubmission Of Audited Financial Results For The Fourth Quarter And Financial Year Ended March 31 2026
20-Jun-2026 | Source : BSEwith Reference to Disclosure made under Regulation 33 of SEBI (LODR) Regulations 2015 on May 30 2026 and the E-mail reveived from BSE regarding submission of details for determination of Large Corporate (LC) status for FY 2025-26. We would like to inform you that while submitting the financial results on the BSE portal the filling was inadvertently made under the Quarterly submission category instead of Yearly option. Accordingly we are resubmitting the Audited Financial Results for the quarter and Financial year ended March 31 2026 along with the requisite details for determination of Large Corporate status for FY 2025-26
Corporate Actions

No Upcoming Board Meetings

Swasti Vinayaka Art & Heritage Corporation Ltd has declared 20% dividend, ex-date: 19 Sep 19

No Splits history available

Swasti Vinayaka Art & Heritage Corporation Ltd has announced 5:4 bonus issue, ex-date: 01 Jul 22

No Rights history available
Quality key factors
Valuation key factors
Technicals key factors
 Technical Indicator Scale: Bearish, Mildly Bearish, Sideways, Mildly Bullish, Bullish Turned
 Shareholding Snapshot : Jun 2026
Shareholding Compare (%holding)
Promoters
None
Held by 0 Schemes
Held by 0 FIIs
Rajesh Ramprasad Poddar (22.47%)
Kanai Banerjee (1.72%)
44.1%
Quarterly Results Snapshot (Standalone) - Mar'26 - QoQ

QoQ Growth in quarter ended Mar 2026 is 85.47% vs 72.48% in Dec 2025
QoQ Growth in quarter ended Mar 2026 is 231.33% vs 7.79% in Dec 2025
Half Yearly Results Snapshot (Standalone) - Sep'25

Growth in half year ended Sep 2025 is 12.55% vs 100.50% in Sep 2024
Growth in half year ended Sep 2025 is 149.44% vs -32.58% in Sep 2024
Nine Monthly Results Snapshot (Standalone) - Dec'25
YoY Growth in nine months ended Dec 2025 is 29.53% vs 69.90% in Dec 2024
YoY Growth in nine months ended Dec 2025 is 122.63% vs -32.18% in Dec 2024
Annual Results Snapshot (Standalone) - Mar'26
YoY Growth in year ended Mar 2026 is 67.72% vs 52.67% in Mar 2025
YoY Growth in year ended Mar 2026 is 150.43% vs 13.17% in Mar 2025
About Swasti Vinayaka Art & Heritage Corporation Ltd

Company Coordinates


