
Compare Swati Projects with Similar Stocks
Dashboard
Strong Long Term Fundamental Strength with an average Return on Equity (ROE) of 15.41%
Healthy long term growth as Net Sales has grown by an annual rate of 147.44% and Operating profit at 85.66%
With a growth in Operating Profit of 260.22%, the company declared Very Positive results in Mar 26
With ROE of 36.2, it has a Very Attractive valuation with a 2 Price to Book Value
Majority shareholders : Non Institution
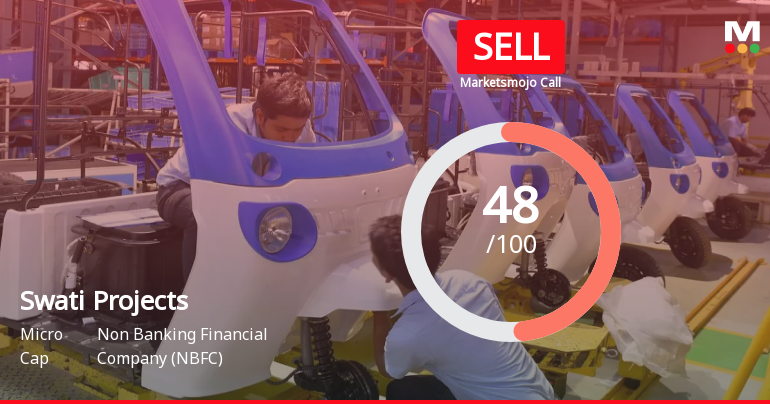
Below par performance in long term as well as near term
Stock DNA
Non Banking Financial Company (NBFC)
INR 31 Cr (Micro Cap)
5.00
21
0.00%
0.04
36.17%
1.93
Total Returns (Price + Dividend) 
Swati Projects for the last several years.
Risk Adjusted Returns v/s
Returns Beta

News
Swati Projects Ltd Downgraded to Sell Amid Mixed Financials and Weak Technicals
Swati Projects Ltd, a micro-cap player in the Non Banking Financial Company (NBFC) sector, has seen its investment rating downgraded from Hold to Sell as of 7 July 2026. This change reflects a complex interplay of factors including deteriorating technical indicators, valuation concerns, and mixed financial trends despite strong underlying fundamentals.
Read full news article
Swati Projects Ltd Upgraded to Hold by MarketsMOJO on Improved Technical and Financial Metrics
Swati Projects Ltd, a micro-cap player in the Non Banking Financial Company (NBFC) sector, has seen its investment rating upgraded from Sell to Hold as of 2 July 2026. This change reflects a combination of improved technical indicators, robust financial performance, attractive valuation metrics, and solid quality fundamentals, signalling a cautious but optimistic outlook for investors.
Read full news article
Swati Projects Ltd Downgraded to Sell Amid Mixed Financials and Weak Technicals
Swati Projects Ltd, a micro-cap player in the Non Banking Financial Company (NBFC) sector, has seen its investment rating downgraded from Hold to Sell as of 24 June 2026. Despite robust financial performance in recent quarters, the downgrade reflects a combination of deteriorating technical indicators, valuation concerns, and underwhelming market returns relative to benchmarks.
Read full news article Announcements
Compliances-Certificate under Reg. 74 (5) of SEBI (DP) Regulations 2018
15-Jul-2026 | Source : BSECERTIFICATE UNDER REGULATION 74(5) OF SEBI FOR THE QUARTER ENDED JUNE 30 2026
Closure of Trading Window
29-Jun-2026 | Source : BSEINTIMATION OF CLOSURE OF TRADING WINDOW
Disclosure Under Regulation 30 Of The SEBI (Listing Obligation And Disclosure Requirements) Regulations 2015- Investment In Wholly Owned Subsidiary Of The Company.
26-Jun-2026 | Source : BSEThis is in continuation of our earlier intimation dated 25th June 2026 regarding the proposed allotment of 1000000 equity of Rs 10/- each of Radhashree Roadsters Private Limited wholly owned subsidary for cash at par .
Corporate Actions

No Upcoming Board Meetings

No Dividend history available

No Splits history available

No Bonus history available

No Rights history available
Quality key factors
Valuation key factors
Technicals key factors
 Technical Indicator Scale: Bearish, Mildly Bearish, Sideways, Mildly Bullish, Bullish Turned
 Shareholding Snapshot : Mar 2026
Shareholding Compare (%holding)
Non Institution
None
Held by 0 Schemes
Held by 0 FIIs
Ganpati Stocks Private Limited (22.28%)
Radhashree Finance Limited (14.85%)
40.65%
Quarterly Results Snapshot (Consolidated) - Mar'26 - QoQ

QoQ Growth in quarter ended Mar 2026 is 223.73% vs -90.00% in Dec 2025
QoQ Growth in quarter ended Mar 2026 is 293.88% vs -87.37% in Dec 2025
Half Yearly Results Snapshot (Consolidated) - Sep'25
Growth in half year ended Sep 2025 is 2,931.25% vs 17.65% in Sep 2024
Growth in half year ended Sep 2025 is 719.05% vs 44.83% in Sep 2024
Nine Monthly Results Snapshot (Consolidated) - Dec'25
YoY Growth in nine months ended Dec 2025 is 1,931.30% vs 21.30% in Dec 2024
YoY Growth in nine months ended Dec 2025 is 504.62% vs 14.04% in Dec 2024
Annual Results Snapshot (Consolidated) - Mar'26
YoY Growth in year ended Mar 2026 is 2,310.56% vs -3.40% in Mar 2025
YoY Growth in year ended Mar 2026 is 5,607.69% vs -123.64% in Mar 2025
About Swati Projects Ltd

Company Coordinates


