
Compare Swelect Energy with Similar Stocks
Dashboard
Healthy long term growth as Operating profit has grown by an annual rate 35.91%
The company has declared Positive results for the last 5 consecutive quarters
With ROCE of 8.2, it has a Very Attractive valuation with a 1 Enterprise value to Capital Employed
Despite the size of the company, domestic mutual funds hold only 0% of the company
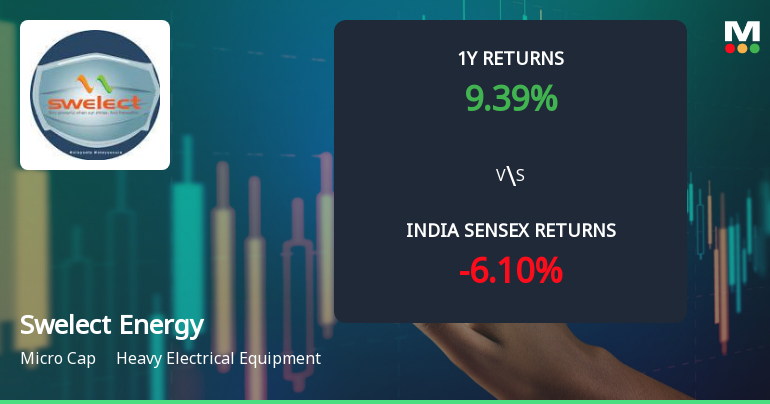
Market Beating performance in long term as well as near term
Stock DNA
Heavy Electrical Equipment
INR 964 Cr (Micro Cap)
17.00
54
0.47%
0.36
6.13%
1.05
Total Returns (Price + Dividend) 
Latest dividend: 3 per share ex-dividend date: Jul-18-2025
Risk Adjusted Returns v/s
Returns Beta

News
Swelect Energy Systems Ltd Technical Momentum Shifts Amid Mixed Indicators
Swelect Energy Systems Ltd, a micro-cap player in the Heavy Electrical Equipment sector, has experienced a notable shift in its technical momentum, moving from a sideways trend to a mildly bearish stance. Despite a recent downgrade in its technical trend, the stock’s mixed signals across key indicators such as MACD, RSI, Bollinger Bands, and moving averages suggest a complex outlook for investors navigating this evolving landscape.
Read full news article
Swelect Energy Systems Ltd is Rated Hold
Swelect Energy Systems Ltd is rated 'Hold' by MarketsMOJO, with this rating last updated on 23 May 2026. While the rating was revised on that date, the analysis and financial metrics discussed here reflect the company’s current position as of 16 June 2026, providing investors with the latest insights into its performance and outlook.
Read full news article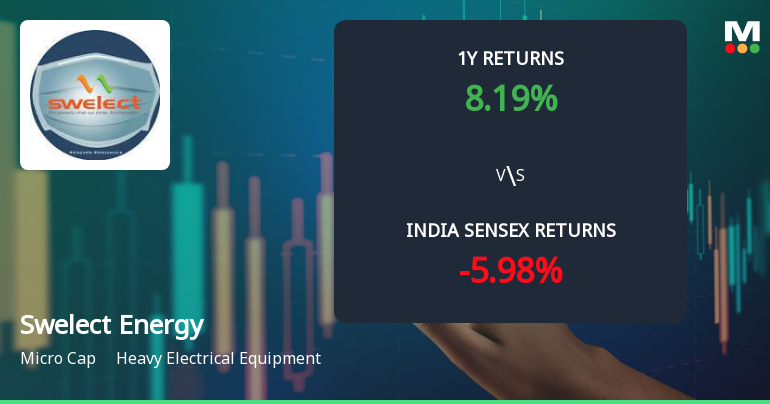
Swelect Energy Systems Ltd Technical Momentum Shifts Amid Mixed Market Signals
Swelect Energy Systems Ltd, a micro-cap player in the Heavy Electrical Equipment sector, has recently exhibited a notable shift in its technical momentum, moving from a mildly bearish stance to a sideways trend. This transition is underscored by a complex interplay of technical indicators, including MACD, RSI, Bollinger Bands, and moving averages, which collectively paint a nuanced picture for investors analysing the stock’s near-term prospects.
Read full news article Announcements
Newspaper Publication Of Notice Regarding Intimation To Shareholders In Respect Of Transfer Of Equity Shares Of The Company To Investor Education And Protection Fund.
11-Jun-2026 | Source : BSENewspaper Publication of Notice regarding intimation to shareholders in respect of transfer of equity shares of the Company to Investor Education and Protection Fund.
Compliances-Reg.24(A)-Annual Secretarial Compliance
29-May-2026 | Source : BSESubmission of Annual Secretarial Compliance Report for the Financial Year ended 31.03.2026
Announcement under Regulation 30 (LODR)-Acquisition
28-May-2026 | Source : BSEIntimation of Acquisition of USolar Assetco Four Private Limited
Corporate Actions

No Upcoming Board Meetings

Swelect Energy Systems Ltd has declared 35% dividend, ex-date: 24 Jul 26

No Splits history available

Swelect Energy Systems Ltd has announced 1:2 bonus issue, ex-date: 22 Aug 19

No Rights history available
Quality key factors
Valuation key factors
Technicals key factors
 Technical Indicator Scale: Bearish, Mildly Bearish, Sideways, Mildly Bullish, Bullish Turned
 Shareholding Snapshot : Mar 2026
Shareholding Compare (%holding)
Promoters
None
Held by 0 Schemes
Held by 11 FIIs (0.23%)
Chellappan R (48.8%)
Pratiksha Satishchandra Doshi (1.54%)
33.88%
Quarterly Results Snapshot (Consolidated) - Mar'26 - QoQ

QoQ Growth in quarter ended Mar 2026 is 46.01% vs -0.17% in Dec 2025
QoQ Growth in quarter ended Mar 2026 is 10.15% vs -38.96% in Dec 2025
Half Yearly Results Snapshot (Consolidated) - Sep'25

Growth in half year ended Sep 2025 is 1.48% vs 84.44% in Sep 2024
Growth in half year ended Sep 2025 is 146.11% vs -18.21% in Sep 2024
Nine Monthly Results Snapshot (Consolidated) - Dec'25
YoY Growth in nine months ended Dec 2025 is 12.87% vs 73.33% in Dec 2024
YoY Growth in nine months ended Dec 2025 is 1,102.41% vs -85.43% in Dec 2024
Annual Results Snapshot (Consolidated) - Mar'26
YoY Growth in year ended Mar 2026 is 5.70% vs 156.06% in Mar 2025
YoY Growth in year ended Mar 2026 is 337.86% vs -79.68% in Mar 2025
About Swelect Energy Systems Ltd

Company Coordinates


