
Compare T & I Global with Similar Stocks
Stock DNA
Industrial Manufacturing
INR 84 Cr (Micro Cap)
12.00
59
0.00%
-0.15
7.06%
0.85
Total Returns (Price + Dividend) 
Latest dividend: 0.5 per share ex-dividend date: Sep-12-2018
Risk Adjusted Returns v/s
Returns Beta

News
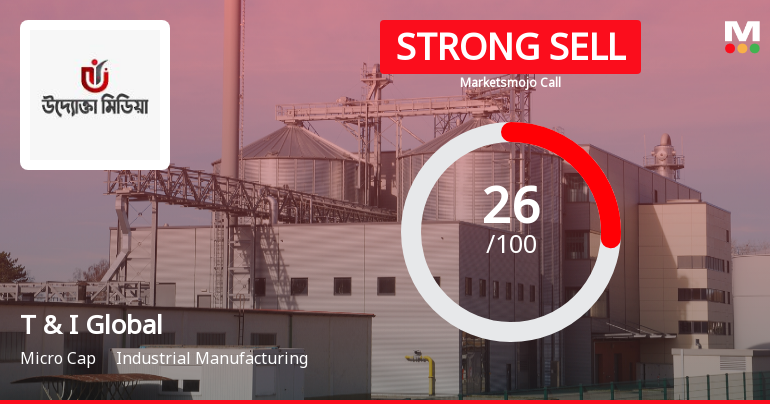
T & I Global Ltd Downgraded to Strong Sell Amid Bearish Technicals and Weak Fundamentals
T & I Global Ltd, a micro-cap player in the industrial manufacturing sector, has seen its investment rating downgraded from Sell to Strong Sell as of 8 June 2026. This shift reflects deteriorating technical indicators, modest financial trends, and valuation concerns despite recent positive quarterly results. The company’s Mojo Score now stands at 26.0, signalling heightened caution for investors.
Read full news article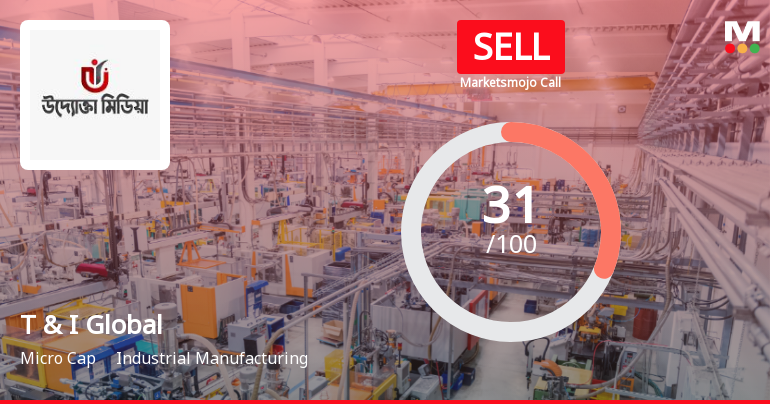
T & I Global Ltd Upgraded from Strong Sell to Sell on Technical and Valuation Improvements
T & I Global Ltd, a micro-cap player in the industrial manufacturing sector, has seen its investment rating upgraded from Strong Sell to Sell as of 1 June 2026. This change reflects a nuanced improvement across technical indicators and valuation metrics, despite ongoing challenges in financial trends and quality scores. The company’s stock price has shown modest gains, supported by positive quarterly results and a more balanced market outlook.
Read full news article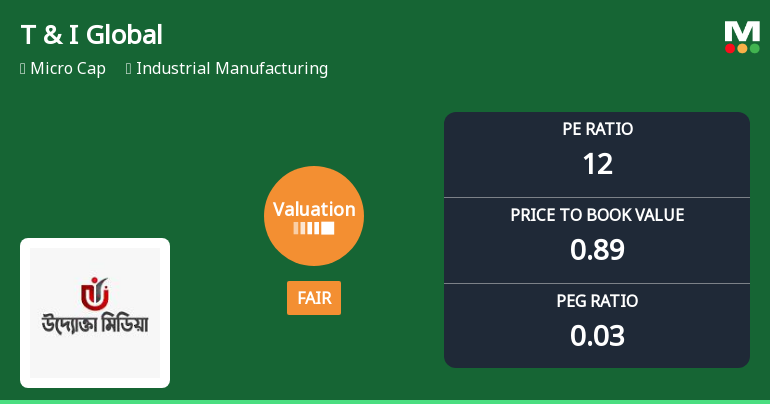
T & I Global Ltd Valuation Shifts Signal Improved Price Attractiveness
T & I Global Ltd, a micro-cap player in the industrial manufacturing sector, has witnessed a notable shift in its valuation parameters, moving from an expensive to a fair valuation territory. This change, coupled with a recent upgrade in its Mojo Grade from Strong Sell to Sell, reflects a nuanced improvement in price attractiveness despite ongoing challenges in profitability and returns.
Read full news article Announcements
NEWSPAPER ADVERTISEMENT
31-May-2026 | Source : BSENEWSPAPER ADVERTISENET FOR THE QUARTER AND YEAR ENDED 31ST MARCH 2026
RESULTS-FOR THE QUARTER AND YEAR ENDED 31ST MARCH 2026
30-May-2026 | Source : BSERESULTS- FOR THE QURTER AND YEAR ENDED 31ST MARCH 2026
Compliances-Reg.24(A)-Annual Secretarial Compliance
30-May-2026 | Source : BSEANNUAL SECRETARIAL COMPLIANCE FOR THE YEAR ENDED 31ST MARCH 2026
Corporate Actions

No Upcoming Board Meetings

T & I Global Ltd has declared 5% dividend, ex-date: 12 Sep 18

No Splits history available

No Bonus history available

No Rights history available
Quality key factors
Valuation key factors
Technicals key factors
 Technical Indicator Scale: Bearish, Mildly Bearish, Sideways, Mildly Bullish, Bullish Turned
 Shareholding Snapshot : Mar 2026
Shareholding Compare (%holding)
Promoters
None
Held by 0 Schemes
Held by 0 FIIs
T & I Projects Ltd. (14.99%)
P P Zibi Jose (2.35%)
40.03%
Quarterly Results Snapshot (Standalone) - Mar'26 - QoQ

QoQ Growth in quarter ended Mar 2026 is 66.81% vs 0.04% in Dec 2025

QoQ Growth in quarter ended Mar 2026 is -98.05% vs 44.63% in Dec 2025
Half Yearly Results Snapshot (Standalone) - Sep'25
Growth in half year ended Sep 2025 is 57.29% vs -65.38% in Sep 2024
Growth in half year ended Sep 2025 is 37.22% vs -58.34% in Sep 2024
Nine Monthly Results Snapshot (Standalone) - Dec'25
YoY Growth in nine months ended Dec 2025 is 46.73% vs -61.20% in Dec 2024
YoY Growth in nine months ended Dec 2025 is 86.76% vs -65.42% in Dec 2024
Annual Results Snapshot (Standalone) - Mar'26
YoY Growth in year ended Mar 2026 is 49.56% vs -54.00% in Mar 2025
YoY Growth in year ended Mar 2026 is 70.59% vs -58.95% in Mar 2025
About T & I Global Ltd

Company Coordinates


