
Compare T T with Similar Stocks
Dashboard
Weak Long Term Fundamental Strength with a -20.91% CAGR growth in Operating Profits over the last 5 years
- Low ability to service debt as the company has a high Debt to EBITDA ratio of 7.36 times
- The company has been able to generate a Return on Equity (avg) of 4.98% signifying low profitability per unit of shareholders funds
Flat results in Mar 26
Below par performance in long term as well as near term
Stock DNA
Garments & Apparels
INR 186 Cr (Micro Cap)
616.00
23
0.71%
0.63
0.24%
1.45
Total Returns (Price + Dividend) 
Latest dividend: 0.05 per share ex-dividend date: Sep-17-2025
Risk Adjusted Returns v/s
Returns Beta

News

T T Ltd Valuation Shifts to Attractive Amidst Mixed Market Returns
T T Ltd, a micro-cap player in the Garments & Apparels sector, has seen a notable shift in its valuation parameters, moving from a very attractive to an attractive rating despite persistently high price multiples. This article analyses the recent changes in its price-to-earnings (P/E) and price-to-book value (P/BV) ratios, compares them with peer averages and historical benchmarks, and assesses the implications for investors amid a challenging market backdrop.
Read full news article
T T Ltd is Rated Strong Sell by MarketsMOJO
T T Ltd is rated Strong Sell by MarketsMOJO, with this rating last updated on 01 Aug 2025. However, the analysis and financial metrics presented here reflect the stock's current position as of 29 May 2026, providing investors with an up-to-date view of the company's performance and outlook.
Read full news article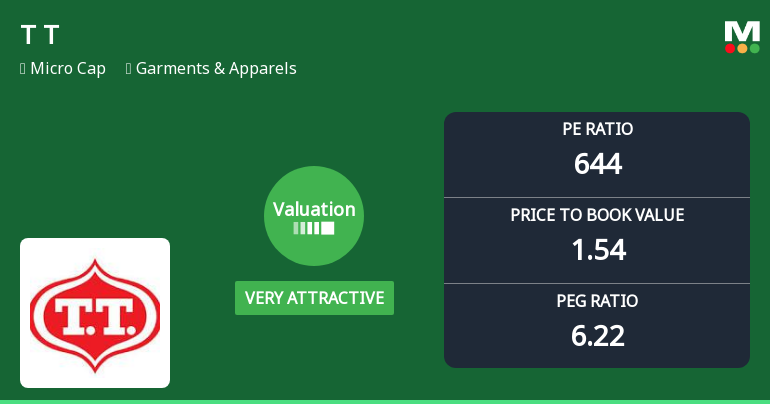
T T Ltd Valuation Shifts to Very Attractive Amidst Challenging Market Performance
T T Ltd, a micro-cap player in the Garments & Apparels sector, has seen a notable shift in its valuation parameters, moving from an attractive to a very attractive rating despite ongoing market headwinds. This change comes amid a backdrop of subdued stock performance and challenging financial metrics, raising questions about the stock’s price attractiveness relative to its historical and peer averages.
Read full news article Announcements
Compliances-Reg.24(A)-Annual Secretarial Compliance
26-May-2026 | Source : BSEAnnual Secretarial Compliance Report for the year ended March 2026.
Compliances-Reg.24(A)-Annual Secretarial Compliance
26-May-2026 | Source : BSERevised Annual Secretarial Compliance Report for the year ended March 2026
Announcement under Regulation 30 (LODR)-Newspaper Publication
23-May-2026 | Source : BSENewspaper Publication
Corporate Actions

No Upcoming Board Meetings

T T Ltd has declared 5% dividend, ex-date: 17 Sep 25

T T Ltd has announced 1:10 stock split, ex-date: 12 Feb 25

No Bonus history available

T T Ltd has announced 4:27 rights issue, ex-date: 04 Jul 25
Quality key factors
Valuation key factors
Technicals key factors
 Technical Indicator Scale: Bearish, Mildly Bearish, Sideways, Mildly Bullish, Bullish Turned
 Shareholding Snapshot : Mar 2026
Shareholding Compare (%holding)
Promoters
None
Held by 0 Schemes
Held by 0 FIIs
T T Brands Ltd. (34.38%)
Gandhi Tejas Harilal (5.12%)
39.44%
Quarterly Results Snapshot (Standalone) - Mar'26 - QoQ

QoQ Growth in quarter ended Mar 2026 is 40.65% vs -11.12% in Dec 2025
QoQ Growth in quarter ended Mar 2026 is 169.00% vs -655.56% in Dec 2025
Half Yearly Results Snapshot (Standalone) - Sep'25
Growth in half year ended Sep 2025 is -1.59% vs -11.24% in Sep 2024

Growth in half year ended Sep 2025 is -91.67% vs 1,141.38% in Sep 2024
Nine Monthly Results Snapshot (Standalone) - Dec'25
YoY Growth in nine months ended Dec 2025 is -11.52% vs -4.83% in Dec 2024
YoY Growth in nine months ended Dec 2025 is -104.87% vs 613.12% in Dec 2024
Annual Results Snapshot (Standalone) - Mar'26
YoY Growth in year ended Mar 2026 is -10.68% vs 1.61% in Mar 2025
YoY Growth in year ended Mar 2026 is -92.93% vs -11.45% in Mar 2025
About T T Ltd

Company Coordinates


