
Compare Tasty Bite Eat. with Similar Stocks
Total Returns (Price + Dividend) 
Latest dividend: 2 per share ex-dividend date: Aug-01-2025
Risk Adjusted Returns v/s
Returns Beta

News
Tasty Bite Eatables Ltd is Rated Sell
Tasty Bite Eatables Ltd is rated 'Sell' by MarketsMOJO, with this rating last updated on 10 February 2026. However, the analysis and financial metrics discussed here reflect the stock's current position as of 09 June 2026, providing investors with an up-to-date perspective on the company’s fundamentals, valuation, financial trends, and technical outlook.
Read full news article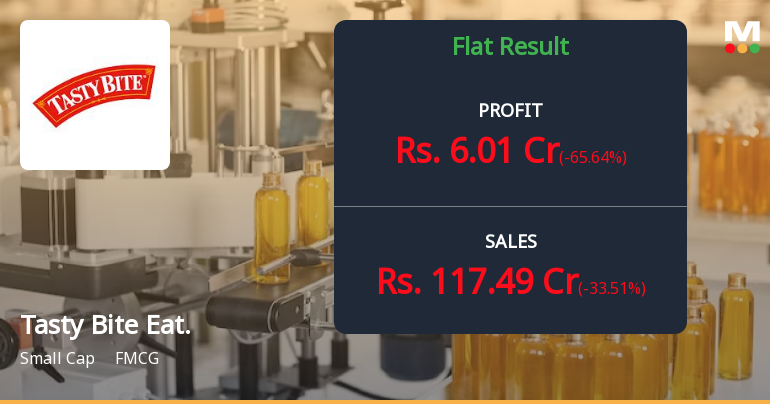
Tasty Bite Eatables Q4 FY26: Seasonal Slump Overshadows Half-Year Gains
Tasty Bite Eatables Ltd., the Pune-based ready-to-serve ethnic food manufacturer, reported a challenging fourth quarter for FY26, with net profit declining 65.63% quarter-on-quarter to ₹6.01 crores from ₹17.49 crores in Q3 FY26. Year-on-year, the decline was milder at 2.90%, down from ₹6.19 crores in Q4 FY25. The stock, trading at ₹7,611.70 with a market capitalisation of ₹1,963 crores, has faced significant headwinds over the past year, declining 27.37% whilst the broader FMCG sector fell just 5.30%.
Read full news article
Tasty Bite Eatables Ltd is Rated Sell
Tasty Bite Eatables Ltd is rated 'Sell' by MarketsMOJO, with this rating last updated on 10 Feb 2026. However, the analysis and financial metrics discussed here reflect the stock's current position as of 28 May 2026, providing investors with the latest insights into its performance and outlook.
Read full news article Announcements
Announcement under Regulation 30 (LODR)-Newspaper Publication
12-Jun-2026 | Source : BSECopy of Newspaper Advertisement published on 12 June 2026 pertaining to Transfer of Securities to IEPF
Announcement under Regulation 30 (LODR)-Change in Management
05-Jun-2026 | Source : BSEThis is to inform that Mr. Shivhari Magar has tendered his resignation from post of Associate Director of Corporate affairs w.e.f close of working hours of 05th June 2026
Shareholder Meeting / Postal Ballot-Notice of Postal Ballot
03-Jun-2026 | Source : BSEPostal ballot Notice dated 29th May 2025 to transact the business contained in the notice.
Corporate Actions

No Upcoming Board Meetings

Tasty Bite Eatables Ltd has declared 20% dividend, ex-date: 01 Aug 25

No Splits history available

No Bonus history available

No Rights history available
Quality key factors
Valuation key factors
Technicals key factors
 Technical Indicator Scale: Bearish, Mildly Bearish, Sideways, Mildly Bullish, Bullish Turned
 Shareholding Snapshot : Mar 2026
Shareholding Compare (%holding)
Promoters
None
Held by 1 Schemes (0.0%)
Held by 11 FIIs (3.67%)
Preferred Brands Foods India Private Ltd (74.22%)
Jupiter India Fund (2.67%)
18.4%
Quarterly Results Snapshot (Standalone) - Mar'26 - QoQ

QoQ Growth in quarter ended Mar 2026 is -33.51% vs 33.20% in Dec 2025
QoQ Growth in quarter ended Mar 2026 is -65.64% vs 383.15% in Dec 2025
Half Yearly Results Snapshot (Standalone) - Sep'25

Growth in half year ended Sep 2025 is 5.12% vs -19.10% in Sep 2024
Growth in half year ended Sep 2025 is 85.11% vs -80.51% in Sep 2024
Nine Monthly Results Snapshot (Standalone) - Dec'25
YoY Growth in nine months ended Dec 2025 is 2.55% vs -2.55% in Dec 2024
YoY Growth in nine months ended Dec 2025 is 50.95% vs -50.21% in Dec 2024
Annual Results Snapshot (Standalone) - Mar'26
YoY Growth in year ended Mar 2026 is -0.97% vs 2.60% in Mar 2025
YoY Growth in year ended Mar 2026 is 37.84% vs -38.32% in Mar 2025
About Tasty Bite Eatables Ltd

Company Coordinates


