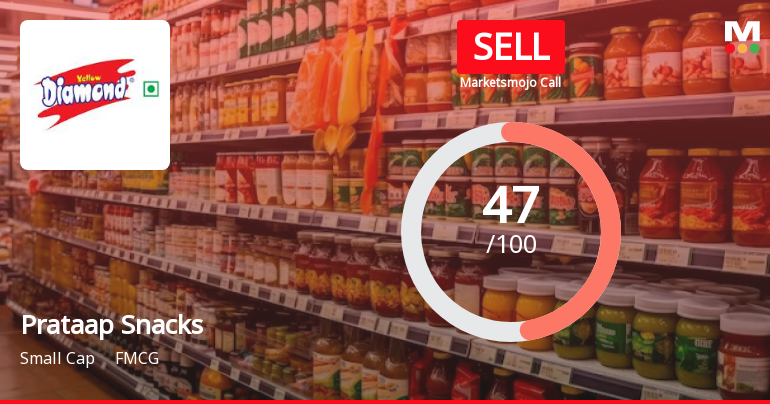
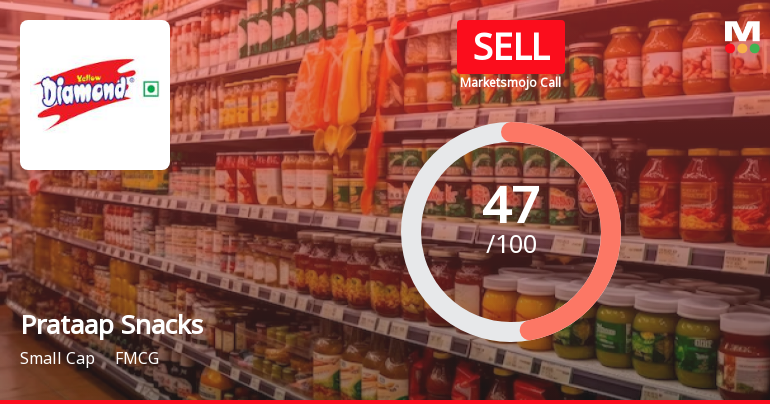
Prataap Snacks

INR
1,108.35
26.75 (2.47%)
BSENSE

Sep 21, 03:30 PM

BSE+NSE Vol: 14.63 k

  • Price Points
  • Score
  • Mojo Parameters
  • Total Return
  • News and Corporate Actions
  • Key factors
  • Shareholding
  • Financials
  • CompanyCV
stock-summaryPrice Point
High/Low

1Day

52 Week

Valuation
Technical
Day's Volume

CASH

14.63 k (36.52%) Volume

Shareholding (Jun 2026)

FII

4.38%

Held by 29 FIIs

DII

7.35%

Held by 0 DIIs

Promoter

56.77%

Why is Prataap Snacks Ltd falling/rising?

06-Sep-2026

As of 05-Sep, Prataap Snacks Ltd's stock price is at 1,157.75, down 0.13% after a trend reversal. Despite this short-term decline, the stock has a strong annual return of 14.15% and shows positive investor interest and solid fundamentals.

As of 05-Sep, Prataap Snacks Ltd's stock price is currently at 1,157.75, reflecting a decrease of 1.5 points or 0.13%. This decline follows a trend reversal after three consecutive days of gains, indicating a temporary pullback in the stock's performance. Despite this recent drop, the stock has shown resilience over the past year, generating a return of 14.15%, significantly outperforming the broader market, which has only returned 1.51%.<BR><BR>The stock's performance today is described as inline with the sector, and it has traded within a narrow range of Rs 10.8. Notably, the stock remains above its 100-day and 200-day moving averages, although it is below the shorter-term moving averages of 5-day, 20-day, and 50-day, suggesting mixed signals regarding its short-term momentum.<BR><BR>Investor participation appears to be increasing, as evidenced by a 53.98% rise in delivery volume on September 3 compared to the 5-day average. This indicates growing interest among investors, which could support future price stability or recovery.<BR><BR>Positive factors contributing to the stock's overall performance include a low debt-to-equity ratio of 0.05, consistent positive results over the last four quarters, and rising promoter confidence, with promoters increasing their stake by 1.18%. These elements reflect a strong underlying business performance, even as the stock experiences a slight decline in the short term.

View full answer

Who are in the management team of Prataap Snacks?

01-Sep-2026

The management team of Prataap Snacks includes Arvind Mehta (Chairman and CEO), Amit Kumar (Managing Director), Apoorva Kumat (Operations), and several independent and non-executive directors, all contributing to the company's strategic direction.

The management team of Prataap Snacks includes the following key individuals:<BR><BR>1. **Arvind Mehta** - Chairman, Executive Director, and CEO<BR>2. **Amit Kumar** - Executive Director, Managing Director, CEO, and Promoter<BR>3. **Apoorva Kumat** - Executive Director (Operations)<BR>4. **Ganapathyagraharam Venkataraman Ravishankar** - Non-Executive Director<BR>5. **Anisha Motwani** - Independent Non-Executive Director<BR>6. **Vineet Kumar Kapila** - Independent Non-Executive Director<BR>7. **Chetan Mathur** - Independent Non-Executive Director<BR>8. **Bharadwaj Thiruvvenkata Venkata Varaghavan** - Independent Non-Executive Director<BR>9. **Bharat Singh** - Non-Executive Director<BR><BR>This team plays a crucial role in guiding the company's operations and strategic direction.

View full answer

What does Prataap Snacks do?

01-Sep-2026

Prataap Snacks Ltd is a Small Cap company in the FMCG sector, primarily focused on snack foods. As of June 2026, it reported net sales of 490 Cr and a net profit of 2 Cr.

Overview:<BR>Prataap Snacks Ltd is primarily engaged in the business of snack foods and operates within the FMCG industry, categorized as a Small Cap company.<BR><BR>History:<BR>Prataap Snacks Ltd was incorporated as a Private Limited Company on March 23, 2009, in Gwalior. It later converted into a Public Limited Company and changed its name to Prataap Snacks Limited on September 19, 2016. The latest quarterly results reported net sales and net profit for June 2026.<BR><BR>Financial Snapshot:<BR>Net Sales: 490 Cr (Quarterly Results - Jun 2026) <BR>Net Profit: 2 Cr (Quarterly Results - Jun 2026) <BR>Market Cap: INR 2,741 Cr (Small Cap)<BR><BR>Key Metrics:<BR>P/E: 205.00 <BR>Industry P/E: 44 <BR>Dividend Yield: 0.00% <BR>Debt-Equity: 0.04 <BR>Return on Equity: 1.92% <BR>Price to Book: 4.02 <BR><BR>Contact Details:<BR>Address: Khasra No 378/2 Nemawar Road, Near Makrand House Indore Madhya Pradesh : 452020 <BR>Tel: 91-731-2439999 <BR>Email: complianeofficer@yellowdiamond.in <BR>Website: http://www.yellowdiamond.in

View full answer

Who are the peers of the Prataap Snacks?

01-Sep-2026

Prataap Snacks' peers include VST Industries, Gopal Snacks, Heritage Foods, Parag Milk Foods, ADF Foods, Tasty Bite Eat., Eveready Inds., Venky's (India), SKM Egg Prod., and Anondita Medi. In terms of performance, Prataap Snacks has a 1-year return of 26.12%, with most peers showing below-average growth and varying management and capital structures.

Peers: The peers of Prataap Snacks are VST Industries, Gopal Snacks, Heritage Foods, Parag Milk Foods, ADF Foods, Tasty Bite Eat., Eveready Inds., Venky's (India), SKM Egg Prod., and Anondita Medi.<BR><BR>Quality Snapshot: Excellent management risk is observed at VST Industries, while Good management risk is found at Gopal Snacks, and Average management risk is present at Heritage Foods, Parag Milk Foods, ADF Foods, Prataap Snacks, Tasty Bite Eat., Eveready Inds., Venky's (India), SKM Egg Prod., and Anondita Medi. All peers exhibit Below Average growth except for SKM Egg Prod., which has Good growth, while Prataap Snacks, Tasty Bite Eat., Eveready Inds., and Anondita Medi show Average growth. Excellent capital structure is noted at VST Industries, Gopal Snacks, ADF Foods, and Venky's (India), while Prataap Snacks and SKM Egg Prod. have Good capital structure, and the rest have Below Average capital structure.<BR><BR>Return Snapshot: Parag Milk Foods has the highest 1-year return at 12.61%, while Gopal Snacks has the lowest at -25.46%. Prataap Snacks has a 1-year return of 26.12%, which is significantly higher than both the highest and lowest peers. Additionally, Eveready Inds. and Gopal Snacks are the only peers with negative six-month returns.

View full answer

How big is Prataap Snacks?

01-Sep-2026

As of 31st August, Prataap Snacks Ltd has a market capitalization of 2,741.00 Cr, with recent net sales of 1,652.94 Cr and a net profit of 19.71 Cr. The company reported shareholder's funds of 676.23 Cr and total assets of 911.62 Cr.

As of 31st August, Prataap Snacks Ltd has a market capitalization of 2,741.00 Cr, categorizing it as a Small Cap company.<BR><BR>In the latest 4 quarters, Prataap Snacks reported Net Sales of 1,652.94 Cr and a Net Profit of 19.71 Cr.<BR><BR>For the latest annual period, the company reported Shareholder's Funds of 676.23 Cr and Total Assets of 911.62 Cr.

View full answer

Should I buy, sell or hold Prataap Snacks Ltd?

02-Aug-2026

When is the next results date for Prataap Snacks Ltd?

28-Jul-2026

The next results date for Prataap Snacks Ltd is 01 August 2026.

The next results date for Prataap Snacks Ltd is scheduled for 01 August 2026.

View full answer

Are Prataap Snacks Ltd latest results good or bad?

07-Feb-2026

Prataap Snacks Ltd's latest Q3 FY26 results show a positive net profit of ₹5.60 crores and record revenue of ₹461.58 crores, but concerns remain due to low return on equity and reliance on non-operating income, indicating potential sustainability issues. Overall, the results reflect a cautious outlook despite short-term improvements.

Prataap Snacks Ltd's latest results for Q3 FY26 show a mix of positive and concerning indicators. On the positive side, the company achieved a net profit of ₹5.60 crores, which is the highest in recent quarters, and its revenue reached an all-time high of ₹461.58 crores. Additionally, the operating margin improved to 5.30%, marking the best performance in recent times.<BR><BR>However, despite these improvements, there are significant concerns regarding the sustainability of this performance. The company's five-year average return on equity (ROE) stands at a low 3.54%, which is below industry standards, and its five-year EBIT growth rate has been negative at -212.45%. This suggests that while the company has returned to profitability, it has struggled to generate consistent returns on capital over the long term.<BR><BR>Moreover, a substantial portion of the profit before tax in Q3 FY26 came from non-operating income, indicating a reliance on sources outside of core operations. This raises questions about the robustness of the company's profitability. <BR><BR>In summary, while the latest results indicate a positive turnaround in the short term, the underlying issues related to capital efficiency and profitability remain a concern, making the overall assessment somewhat cautious.

View full answer

Is Prataap Snacks technically bullish or bearish?

02-Dec-2025

As of December 1, 2025, Prataap Snacks shows a mildly bearish trend due to daily moving averages and weekly RSI indicating bearish momentum, despite some bullish signals from the weekly MACD and KST.

As of 1 December 2025, the technical trend for Prataap Snacks has changed from sideways to mildly bearish. The current stance is mildly bearish, primarily driven by the daily moving averages indicating a bearish trend and the weekly RSI showing bearish momentum. While the weekly MACD and KST are bullish, the monthly indicators reflect a mildly bearish outlook. Overall, the mixed signals suggest caution, with the bearish indicators currently holding more weight.

View full answer

How has been the historical performance of Prataap Snacks?

17-Nov-2025

Prataap Snacks has shown significant growth in net sales, increasing from 1,003.79 Cr in Mar'18 to 1,652.93 Cr in Mar'23, with improved profitability reflected in a profit after tax of 20.31 Cr in Mar'23. However, rising raw material costs and fluctuating operating profits present ongoing challenges.

Answer:<BR>The historical performance of Prataap Snacks shows a mixed trend in various financial metrics over the years.<BR><BR>Breakdown:<BR>Prataap Snacks has experienced significant growth in net sales, increasing from 1,003.79 Cr in Mar'18 to 1,652.93 Cr in Mar'23, with a notable jump from 1,396.62 Cr in Mar'22. However, the total operating income followed a similar trajectory, reaching 1,652.93 Cr in Mar'23. The raw material costs have also risen, from 666.73 Cr in Mar'18 to 1,191.02 Cr in Mar'23, indicating increased operational expenses. Operating profit (PBDIT) saw fluctuations, peaking at 102.87 Cr in Mar'20 but declining to 70.19 Cr in Mar'23. The profit before tax turned positive at 1.51 Cr in Mar'23 after a loss of 2.39 Cr in Mar'22, while profit after tax significantly improved to 20.31 Cr from 2.91 Cr in the previous year. The earnings per share (EPS) rose sharply to 8.66 in Mar'23 from 1.24 in Mar'22. On the balance sheet, total assets increased to 911.62 Cr in Mar'23 from 907.25 Cr in Mar'22, with total liabilities remaining relatively stable. Cash flow from operating activities improved to 79.00 Cr in Mar'23, contributing to a net cash inflow of 2.00 Cr. Overall, while Prataap Snacks has shown growth in sales and profitability, it faces challenges with rising costs and fluctuating profit margins.

View full answer

Who are the top shareholders of the Prataap Snacks?

17-Jul-2025

The top shareholders of Prataap Snacks include promoters led by Authum Investment And Infrastructure Limited with 42.93%, followed by individual investors at 21.02%, foreign institutional investors at 6.84%, and India Inflection Opportunity Trust-bharat Value Fund at 4.66%. Mutual funds hold 1.21% through one scheme.

The top shareholders of Prataap Snacks include several key players. The majority of the shares are held by promoters, with Authum Investment And Infrastructure Limited being the largest individual promoter, holding 42.93%. <BR><BR>In addition to the promoters, there is a notable public shareholder, India Inflection Opportunity Trust-bharat Value Fund, which holds 4.66%. The company also has mutual funds holding 1.21% through one scheme, and foreign institutional investors (FIIs) hold 6.84% across 36 different FIIs. Individual investors collectively own 21.02% of the shares. <BR><BR>This distribution highlights a strong promoter presence alongside significant participation from institutional and individual investors.

View full answer

Is Prataap Snacks overvalued or undervalued?

09-Jun-2025

As of May 6, 2025, Prataap Snacks is considered overvalued and risky due to troubling financial ratios, including a PE ratio of -556.16 and an EV to EBIT of -133.70, despite a strong stock return of 31.35% over the past year.

As of 6 May 2025, the valuation grade for Prataap Snacks has moved from expensive to risky, indicating a significant shift in its perceived value. The company is currently considered overvalued, particularly given its troubling financial ratios, including a PE ratio of -556.16, an EV to EBIT of -133.70, and a ROCE of -2.72%. These figures suggest that the company is struggling to generate profits relative to its valuation.<BR><BR>In comparison to its peers, Prataap Snacks stands out with a notably high EV to EBITDA ratio of 56.19, while its PEG ratio remains at 0.00, indicating no growth expectations. Competitors in the FMCG sector, such as Britannia Industries with a PE of 45.32 and Hindustan Unilever with a PE of 61.20, highlight the disparity in valuation metrics. Despite a strong 1-year stock return of 31.35% compared to the Sensex's 7.59%, the underlying financials suggest that Prataap Snacks is not positioned favorably in the market.

View full answer

Has Prataap Snacks declared dividend?

06-Jun-2025

Prataap Snacks Ltd has declared a 20% dividend, amounting to ₹1 per share, with an ex-date of July 27, 2023. Despite this, the dividend yield is 0%, as total returns have primarily come from price appreciation over various periods.

Prataap Snacks Ltd has declared a 20% dividend.<BR><BR>Dividend Details:<BR>- Percentage announced: 20%<BR>- Amount per share: 1 per share<BR>- Ex-date: 27 Jul 23<BR><BR>Dividend Yield: 0%<BR><BR>Total Returns by Period:<BR>In the 6-month period, the price return was 8.74%, with a dividend return of 0%, resulting in a total return of 8.74%.<BR><BR>For the 1-year period, the price return was 28.97%, with a dividend return of 0%, leading to a total return of 28.97%.<BR><BR>Over the 2-year period, the price return was 38.87%, the dividend return was 0.12%, and the total return amounted to 38.99%.<BR><BR>In the 3-year period, the price return reached 64.89%, with a dividend return of 0.23%, culminating in a total return of 65.12%.<BR><BR>For the 4-year period, the price return was 77.83%, the dividend return was 0.29%, resulting in a total return of 78.12%.<BR><BR>In the 5-year period, the price return was 81.16%, with a dividend return of 0.50%, leading to a total return of 81.66%.<BR><BR>Overall, Prataap Snacks has declared a dividend, but the dividend yield remains at 0%. The total returns over various periods indicate a strong price appreciation, particularly over longer durations, despite the minimal contribution from dividends.

View full answer
iScoreScore
Part of MojoOne Strategy
Click here to find our call on this stock
Strong Sell
Sell
Hold
Buy
Strong Buy

Dashboard

1

Company has a Debt to Equity ratio (avg) of 0.01 times

 
2

Poor long term growth as Operating profit has grown by an annual rate -7.63% of over the last 5 years

 
3

The company has declared Positive results for the last 4 consecutive quarters

4

With ROE of 1.9, it has a Very Expensive valuation with a 3.8 Price to Book Value

5

Rising Promoter Confidence

6

Market Beating Performance

stock-summaryMojo Parameters

Mojo Parameters

Loading Valuation Snapshot...

Stock DNA

stock-summary
Industry

FMCG

stock-summary
Market cap

INR 2,603 Cr (Small Cap)

stock-summary
P/E

198.00

stock-summary
Industry P/E

43

stock-summary
Dividend Yield

0.05%

stock-summary
Debt Equity

-0.04

stock-summary
Return on Equity

1.91%

stock-summary
Price to Book

3.70

Revenue and Profits:
Net Sales:
490 Cr
(Quarterly Results - Jun 2026)
Net Profit:
2 Cr
stock-summaryTotal Returns
Total Returns (Price + Dividend) stock-summary
Dividend Yield (0.05%)
TimePeriod
Price Return
Dividend Return
Total Return
3 Months
-2.44%
0.05%
-2.39%
6 Months
22.54%
0.05%
22.59%
1 Year
7.22%
0.05%
7.27%
2 Years
28.6%
0.09%
28.69%
3 Years
25.16%
0.12%
25.28%
4 Years
33.49%
0.23%
33.72%
5 Years
69.51%
0.33%
69.84%

Latest dividend: 0.4993536472760849 per share ex-dividend date: Sep-18-2026

Risk Adjusted Returns v/s stock-summary
Returns Beta
Icon
Beta has not been calculated since enough price history is not available
stock-summaryNews & Corporate Actions

News

Announcements stock-summary

Announcement under Regulation 30 (LODR)-Newspaper Publication

03-Sep-2026 | Source : BSE

Pursuant to Regulation 30 read with Schedule III Part A Para A and Regulation 47 of the SEBI Listing Regulations please find enclosed herewith copies of the newspaper advertisement published today i.e. September 3 2026 in the Free Press (English- All India Editions) and Peoples Samachar (Hindi- All Edition) pertaining Record Date for the purpose of payment of dividend and 17th Annual General Meeting of the Company to be held through Video Conferencing/Other Audio Visual Means on Thursday September 24 2026 at 3:30 p.m (IST).

Business Responsibility and Sustainability Reporting (BRSR)

02-Sep-2026 | Source : BSE

Submission of Business Responsibility and Sustainability Report for the Financial year 2025-26.

Submission Of Annual Report For The Year 2025-26 Including Notice Convening The 17Th Annual General Meeting (AGM).

02-Sep-2026 | Source : BSE

Submission of Annual Report for the year 2025-26 including Notice convening the 17th Annual General Meeting (AGM).

Corporate Actions stock-summary

stock-summary
BOARD MEETING

No Upcoming Board Meetings

stock-summary
DIVIDEND

Prataap Snacks Ltd has declared 10% dividend, ex-date: 18 Sep 26

stock-summary
SPLITS

No Splits history available

stock-summary
BONUS

No Bonus history available

stock-summary
RIGHTS

No Rights history available

stock-summaryKey Factors

Quality key factors stock-summary

Factor
Value
Sales Growth (5y)
10.75%
EBIT Growth (5y)
-7.63%
EBIT to Interest (avg)
3.04
Debt to EBITDA (avg)
0.92
Net Debt to Equity (avg)
-0.04
Sales to Capital Employed (avg)
2.14
Tax Ratio
34.19%
Dividend Payout Ratio
-3.48%
Pledged Shares
0
Institutional Holding
11.73%
ROCE (avg)
2.86%
ROE (avg)
3.22%

Valuation key factors

Factor
Value
P/E Ratio
198
Industry P/E
43
Price to Book Value
3.78
EV to EBIT
156.36
EV to EBITDA
31.56
EV to Capital Employed
3.90
EV to Sales
1.45
PEG Ratio
1.00
Dividend Yield
0.05%
ROCE (Latest)
-4.05%
ROE (Latest)
1.91%

Technicals key factors

Indicator
Weekly
Monthly
MACD
Mildly Bearish
Mildly Bearish
RSI
No Signal
No Signal
Bollinger Bands
Mildly Bearish
Mildly Bullish
Moving Averages
Mildly Bullish (Daily)
KST
Mildly Bearish
Mildly Bearish
Dow Theory
Mildly Bearish
Mildly Bullish
OBV
No Trend
No Trend
stock-summary Technical Indicator Scale: Bearish, Mildly Bearish, Sideways, Mildly Bullish, Bullish  Turned 
stock-summaryShareholding
Shareholding Snapshot : Jun 2026stock-summary
Shareholding Compare (%holding) stock-summary
Majority shareholders

Promoters

Pledged Promoter Holdings

None

Mutual Funds

Held by 1 Schemes (0.0%)

FIIs

Held by 29 FIIs (4.38%)

Promoter with highest holding

Authum Investment And Infrastructure Limited (43.66%)

Highest Public shareholder

India Inflection Opportunity Trust-bharat Value Fu (4.66%)

Individual Investors Holdings

16.75%

stock-summaryFinancial
[
  {
    "link": "quarterly",
    "btn_text": "All Quarterly Results",
    "header": "Quarterly Results Snapshot (Standalone) - Jun'26 - YoY",
    "rhs": [
      {
        "prefix": "Net Sales ",
        "suffix": "YoY Growth in quarter ended Jun 2026 is 19.93% vs -2.43% in Jun 2025",
        "dir": 1
      },
      {
        "prefix": "Standalone Net Profit ",
        "suffix": "YoY Growth in quarter ended Jun 2026 is 257.97% vs -92.69% in Jun 2025",
        "dir": 1
      }
    ],
    "table": {
      "header": [
        "Jun'26",
        "Jun'25",
        "Change(%)"
      ],
      "body": [
        {
          "field": "Net Sales",
          "val1": "490.43",
          "val2": "408.94",
          "chgp": "19.93%",
          "chgp_class": "positive"
        },
        {
          "field": "Operating Profit (PBDIT) excl Other Income",
          "val1": "19.04",
          "val2": "18.01",
          "chgp": "5.72%",
          "chgp_class": "positive"
        },
        {
          "field": "Interest",
          "val1": "0.99",
          "val2": "2.24",
          "chgp": "-55.80%",
          "chgp_class": "positive"
        },
        {
          "field": "Exceptional Items",
          "val1": "0.00",
          "val2": "0.00",
          "chgp": "",
          "chgp_class": "neutral"
        },
        {
          "field": "Standalone Net Profit",
          "val1": "2.47",
          "val2": "0.69",
          "chgp": "257.97%",
          "chgp_class": "positive"
        },
        {
          "field": "Operating Profit Margin (Excl OI)",
          "val1": "3.88%",
          "val2": "4.40%",
          "chgp": "-0.52%",
          "chgp_class": "negative"
        }
      ]
    }
  },
  {
    "link": "half-yearly",
    "btn_text": "All Half Yearly Results",
    "header": "Half Yearly Results Snapshot (Standalone) - Sep'25",
    "rhs": [
      {
        "prefix": "Net Sales ",
        "suffix": " Growth in half year ended Sep 2025 is -2.23% vs 4.95% in Sep 2024",
        "dir": -1
      },
      {
        "prefix": "Standalone Net Profit ",
        "suffix": " Growth in half year ended Sep 2025 is -65.81% vs -47.95% in Sep 2024",
        "dir": -1
      }
    ],
    "table": {
      "header": [
        "Sep'25",
        "Sep'24",
        "Change(%)"
      ],
      "body": [
        {
          "field": "Net Sales",
          "val1": "838.73",
          "val2": "857.87",
          "chgp": "-2.23%",
          "chgp_class": "negative"
        },
        {
          "field": "Operating Profit (PBDIT) excl Other Income",
          "val1": "40.91",
          "val2": "49.19",
          "chgp": "-16.83%",
          "chgp_class": "negative"
        },
        {
          "field": "Interest",
          "val1": "4.04",
          "val2": "3.43",
          "chgp": "17.78%",
          "chgp_class": "negative"
        },
        {
          "field": "Exceptional Items",
          "val1": "0.77",
          "val2": "8.93",
          "chgp": "-91.38%",
          "chgp_class": "negative"
        },
        {
          "field": "Standalone Net Profit",
          "val1": "5.33",
          "val2": "15.59",
          "chgp": "-65.81%",
          "chgp_class": "negative"
        },
        {
          "field": "Operating Profit Margin (Excl OI)",
          "val1": "4.88%",
          "val2": "5.73%",
          "chgp": "-0.85%",
          "chgp_class": "negative"
        }
      ]
    }
  },
  {
    "link": "nine-monthly",
    "btn_text": "All Nine Monthly Results",
    "header": "Nine Monthly Results Snapshot (Standalone) - Dec'25",
    "rhs": [
      {
        "prefix": "Net Sales ",
        "suffix": "YoY Growth in nine months ended Dec 2025 is -0.20% vs 6.29% in Dec 2024",
        "dir": -1
      },
      {
        "prefix": "Standalone Net Profit ",
        "suffix": "YoY Growth in nine months ended Dec 2025 is 138.41% vs -154.84% in Dec 2024",
        "dir": 1
      }
    ],
    "table": {
      "header": [
        "Dec'25",
        "Dec'24",
        "Change(%)"
      ],
      "body": [
        {
          "field": "Net Sales",
          "val1": "1,297.98",
          "val2": "1,300.56",
          "chgp": "-0.20%",
          "chgp_class": "negative"
        },
        {
          "field": "Operating Profit (PBDIT) excl Other Income",
          "val1": "61.22",
          "val2": "43.78",
          "chgp": "39.84%",
          "chgp_class": "positive"
        },
        {
          "field": "Interest",
          "val1": "5.30",
          "val2": "4.96",
          "chgp": "6.85%",
          "chgp_class": "negative"
        },
        {
          "field": "Exceptional Items",
          "val1": "-1.58",
          "val2": "-25.41",
          "chgp": "93.78%",
          "chgp_class": "positive"
        },
        {
          "field": "Standalone Net Profit",
          "val1": "8.58",
          "val2": "-22.34",
          "chgp": "138.41%",
          "chgp_class": "positive"
        },
        {
          "field": "Operating Profit Margin (Excl OI)",
          "val1": "4.69%",
          "val2": "3.35%",
          "chgp": "1.34%",
          "chgp_class": "positive"
        }
      ]
    }
  },
  {
    "link": "annual",
    "btn_text": "All Annual Results",
    "header": "Annual Results Snapshot (Standalone) - Mar'26",
    "rhs": [
      {
        "prefix": "Net Sales ",
        "suffix": "YoY Growth in year ended Mar 2026 is 1.00% vs 5.52% in Mar 2025",
        "dir": -1
      },
      {
        "prefix": "Standalone Net Profit ",
        "suffix": "YoY Growth in year ended Mar 2026 is 128.36% vs -164.51% in Mar 2025",
        "dir": 1
      }
    ],
    "table": {
      "header": [
        "Mar'26",
        "Mar'25",
        "Change(%)"
      ],
      "body": [
        {
          "field": "Net Sales",
          "val1": "1,716.05",
          "val2": "1,699.08",
          "chgp": "1.00%",
          "chgp_class": "positive"
        },
        {
          "field": "Operating Profit (PBDIT) excl Other Income",
          "val1": "81.81",
          "val2": "48.69",
          "chgp": "68.02%",
          "chgp_class": "positive"
        },
        {
          "field": "Interest",
          "val1": "6.54",
          "val2": "6.81",
          "chgp": "-3.96%",
          "chgp_class": "positive"
        },
        {
          "field": "Exceptional Items",
          "val1": "-1.58",
          "val2": "-25.41",
          "chgp": "93.78%",
          "chgp_class": "positive"
        },
        {
          "field": "Standalone Net Profit",
          "val1": "9.72",
          "val2": "-34.27",
          "chgp": "128.36%",
          "chgp_class": "positive"
        },
        {
          "field": "Operating Profit Margin (Excl OI)",
          "val1": "4.77%",
          "val2": "2.87%",
          "chgp": "1.90%",
          "chgp_class": "positive"
        }
      ]
    }
  }
]

Quarterly Results Snapshot (Standalone) - Jun'26 - YoYstock-summary

Jun'26
Jun'25
Change(%)
Net Sales
490.43
408.94
19.93%
Operating Profit (PBDIT) excl Other Income
19.04
18.01
5.72%
Interest
0.99
2.24
-55.80%
Exceptional Items
0.00
0.00
Standalone Net Profit
2.47
0.69
257.97%
Operating Profit Margin (Excl OI)
3.88%
4.40%
-0.52%
Values in Rs Cr.
Direction Arrows
Net Sales

YoY Growth in quarter ended Jun 2026 is 19.93% vs -2.43% in Jun 2025

Direction Arrows
Standalone Net Profit

YoY Growth in quarter ended Jun 2026 is 257.97% vs -92.69% in Jun 2025

Half Yearly Results Snapshot (Standalone) - Sep'25stock-summary

Sep'25
Sep'24
Change(%)
Net Sales
838.73
857.87
-2.23%
Operating Profit (PBDIT) excl Other Income
40.91
49.19
-16.83%
Interest
4.04
3.43
17.78%
Exceptional Items
0.77
8.93
-91.38%
Standalone Net Profit
5.33
15.59
-65.81%
Operating Profit Margin (Excl OI)
4.88%
5.73%
-0.85%
Values in Rs Cr.
Direction Arrows
Net Sales

Growth in half year ended Sep 2025 is -2.23% vs 4.95% in Sep 2024

Direction Arrows
Standalone Net Profit

Growth in half year ended Sep 2025 is -65.81% vs -47.95% in Sep 2024

Nine Monthly Results Snapshot (Standalone) - Dec'25stock-summary

Dec'25
Dec'24
Change(%)
Net Sales
1,297.98
1,300.56
-0.20%
Operating Profit (PBDIT) excl Other Income
61.22
43.78
39.84%
Interest
5.30
4.96
6.85%
Exceptional Items
-1.58
-25.41
93.78%
Standalone Net Profit
8.58
-22.34
138.41%
Operating Profit Margin (Excl OI)
4.69%
3.35%
1.34%
Values in Rs Cr.
Direction Arrows
Net Sales

YoY Growth in nine months ended Dec 2025 is -0.20% vs 6.29% in Dec 2024

Direction Arrows
Standalone Net Profit

YoY Growth in nine months ended Dec 2025 is 138.41% vs -154.84% in Dec 2024

Annual Results Snapshot (Standalone) - Mar'26stock-summary

Mar'26
Mar'25
Change(%)
Net Sales
1,716.05
1,699.08
1.00%
Operating Profit (PBDIT) excl Other Income
81.81
48.69
68.02%
Interest
6.54
6.81
-3.96%
Exceptional Items
-1.58
-25.41
93.78%
Standalone Net Profit
9.72
-34.27
128.36%
Operating Profit Margin (Excl OI)
4.77%
2.87%
1.90%
Values in Rs Cr.
Direction Arrows
Net Sales

YoY Growth in year ended Mar 2026 is 1.00% vs 5.52% in Mar 2025

Direction Arrows
Standalone Net Profit

YoY Growth in year ended Mar 2026 is 128.36% vs -164.51% in Mar 2025

stock-summaryCompany CV
About Prataap Snacks Ltd stock-summary
stock-summary
Prataap Snacks Ltd
Small Cap
FMCG
Prataap Snacks Limited was incorporated as a Private Limited Company with the name 'Prataap Snacks Private Limited' on March 23, 2009 at Gwalior. Thereafter, the Company converted into a Public Limited Company and the name was changed to 'Prataap Snacks Limited' on September 19, 2016. The Company is primarily engaged in the business of snacks food.
Company Coordinates stock-summary
Company Details
Khasra No 378/2 Nemawar Road, Near Makrand House Indore Madhya Pradesh : 452020
stock-summary
Tel: 91-731-2439999
stock-summary
complianeofficer@yellowdiamond.in
Registrar Details
Karvy Computershare Pvt Ltd., Karvy Selenium, Tower-B Plot No 31 & 32, Survey No 116/22, 115/24, 115/25, Financial District, Nanakramguda, Serilingampally, Mandal Ranga Reddy Dist, Hyderabad