
Compare Tatva Chintan with Similar Stocks
Stock DNA
Specialty Chemicals
INR 3,115 Cr (Small Cap)
69.00
45
0.08%
0.14
5.38%
3.71
Total Returns (Price + Dividend) 
Latest dividend: 1 per share ex-dividend date: Sep-12-2025
Risk Adjusted Returns v/s
Returns Beta

News
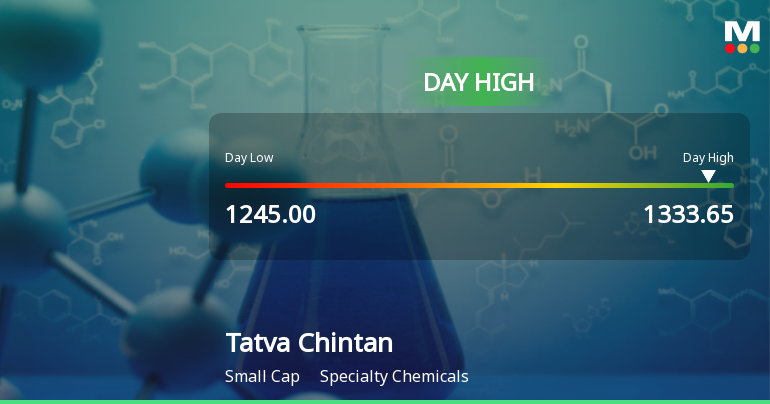
Tatva Chintan Pharma Chem Ltd Surges 7.16% to Day's High of Rs 1329.8 — Outperforms Sector by 4.24 Percentage Points
The Sensex advanced by 0.97% on 10 Jul 2026, yet Tatva Chintan Pharma Chem Ltd outpaced the broader market with a 7.16% gain, reaching an intraday peak of Rs 1329.8. This 4.24 percentage-point outperformance over the Chemicals sector’s 2.54% rise highlights a distinctly stock-specific rally rather than a mere market tailwind.
Read full news article
Tatva Chintan Pharma Chem Ltd Technical Momentum Shifts Amid Mixed Market Signals
Tatva Chintan Pharma Chem Ltd, a small-cap player in the specialty chemicals sector, has experienced a notable shift in its technical momentum, reflecting a complex interplay of bullish and bearish indicators. Despite a recent upgrade in price momentum, the company’s overall technical grade has been downgraded from Hold to Sell, signalling caution for investors amid mixed signals from key technical indicators.
Read full news article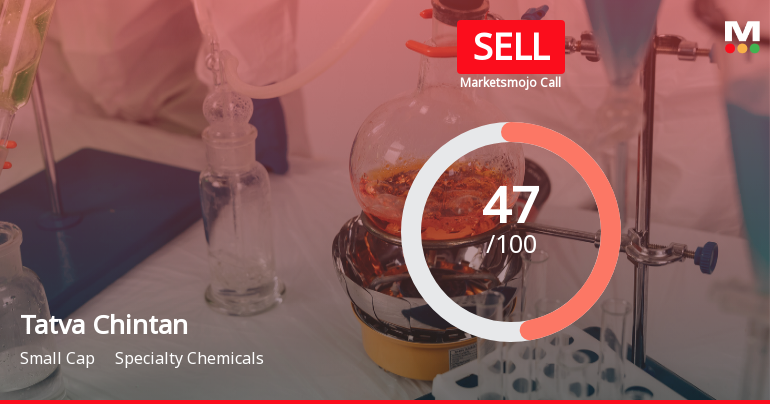
Tatva Chintan Pharma Chem Ltd Downgraded to Sell Amid Mixed Financial and Technical Signals
Tatva Chintan Pharma Chem Ltd, a specialty chemicals company, has seen its investment rating downgraded from Hold to Sell as of 8 July 2026. This change reflects a complex interplay of deteriorating technical indicators, valuation concerns, and subdued long-term financial growth despite recent positive quarterly results. The company’s current Mojo Score stands at 47.0, signalling caution for investors amid a mildly bearish technical outlook and expensive valuation metrics.
Read full news article Announcements
Compliances-Certificate under Reg. 74 (5) of SEBI (DP) Regulations 2018
06-Jul-2026 | Source : BSECertificate under Reg. 74(5) of SEBI (DP) Regulations 2018
Closure of Trading Window
23-Jun-2026 | Source : BSEIntimation of Closure of Trading Window
Announcement under Regulation 30 (LODR)-Analyst / Investor Meet - Intimation
12-Jun-2026 | Source : BSEIntimation of Schedule of Analyst / Institutional Investor Meeting under the SEBI (Listing Obligations and Disclosure Requirements) Regulations 2015.
Corporate Actions

No Upcoming Board Meetings

Tatva Chintan Pharma Chem Ltd has declared 10% dividend, ex-date: 12 Sep 25

No Splits history available

No Bonus history available

No Rights history available
Quality key factors
Valuation key factors
Technicals key factors
 Technical Indicator Scale: Bearish, Mildly Bearish, Sideways, Mildly Bullish, Bullish Turned
 Shareholding Snapshot : Mar 2026
Shareholding Compare (%holding)
Promoters
None
Held by 4 Schemes (2.87%)
Held by 32 FIIs (3.82%)
Shekhar Rasiklal Somani (23.07%)
Goldman Sachs Funds - Goldman Sachs India Equity Portfolio (2.59%)
18.32%
Quarterly Results Snapshot (Consolidated) - Mar'26 - QoQ

QoQ Growth in quarter ended Mar 2026 is 2.14% vs 6.32% in Dec 2025
QoQ Growth in quarter ended Mar 2026 is -31.97% vs 52.92% in Dec 2025
Half Yearly Results Snapshot (Consolidated) - Sep'25

Growth in half year ended Sep 2025 is 27.22% vs -10.46% in Sep 2024
Growth in half year ended Sep 2025 is 264.18% vs -73.68% in Sep 2024
Nine Monthly Results Snapshot (Consolidated) - Dec'25
YoY Growth in nine months ended Dec 2025 is 35.24% vs -6.91% in Dec 2024
YoY Growth in nine months ended Dec 2025 is 576.76% vs -77.40% in Dec 2024
Annual Results Snapshot (Consolidated) - Mar'26
YoY Growth in year ended Mar 2026 is 32.18% vs -2.74% in Mar 2025
YoY Growth in year ended Mar 2026 is 636.43% vs -81.19% in Mar 2025
About Tatva Chintan Pharma Chem Ltd

Company Coordinates


