
Compare TBO Tek with Similar Stocks
Dashboard
High Management Efficiency with a high ROE of 24.07%
The company is Net-Debt Free
Positive results in Mar 26
With ROE of 15.6, it has a Very Expensive valuation with a 10.1 Price to Book Value
High Institutional Holdings at 50.05%
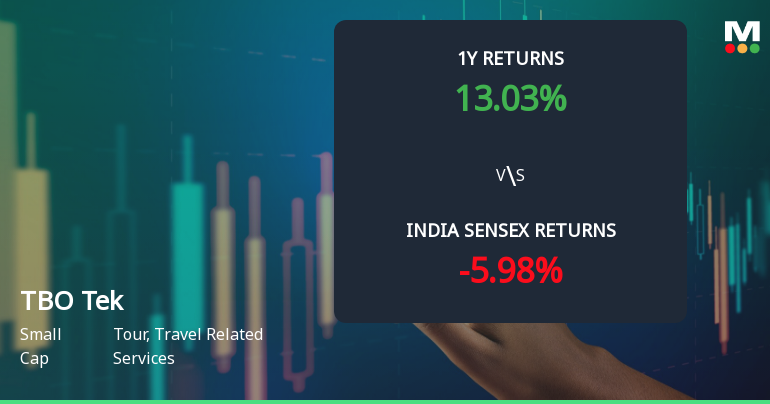
Market Beating Performance
With its market cap of Rs 14,779 cr, it is the second biggest company in the sector (behind I R C T C)and constitutes 19.19% of the entire sector
Stock DNA
Tour, Travel Related Services
INR 15,489 Cr (Small Cap)
64.00
36
0.00%
-0.50
15.62%
10.07
Total Returns (Price + Dividend) 
TBO Tek for the last several years.
Risk Adjusted Returns v/s
Returns Beta

News
TBO Tek Ltd Shares Gain Momentum Amid Technical Shift and Upgraded Rating
TBO Tek Ltd has witnessed a notable shift in its technical momentum, moving from a mildly bearish stance to a more neutral sideways trend, supported by a strong intraday rally that pushed the stock price up by 6.82% on 16 Jun 2026. This change is underscored by mixed signals from key technical indicators such as MACD, RSI, and moving averages, reflecting a complex but cautiously optimistic outlook for investors in the tour and travel services sector.
Read full news article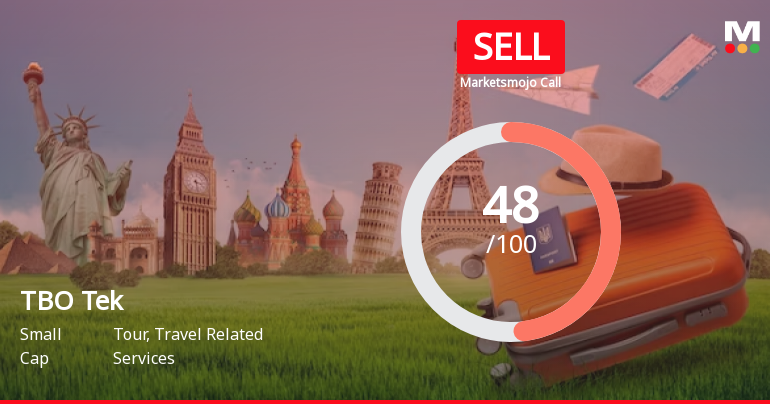
TBO Tek Ltd is Rated Sell by MarketsMOJO
TBO Tek Ltd is rated 'Sell' by MarketsMOJO, with this rating last updated on 03 June 2026. However, the analysis and financial metrics discussed here reflect the stock's current position as of 15 June 2026, providing investors with an up-to-date view of the company’s fundamentals, valuation, financial trends, and technical outlook.
Read full news article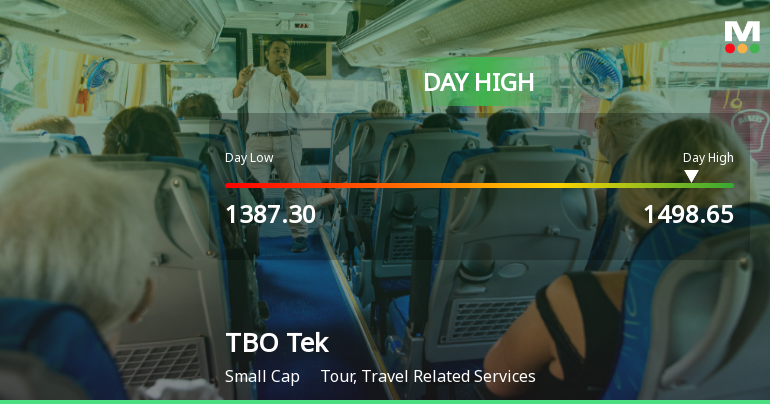
TBO Tek Ltd Surges 8.83% to Day's High of Rs 1474.05 — Outperforms Sector by 6.25 Percentage Points
The Sensex advanced 1.39% on 15 Jun 2026, yet TBO Tek Ltd outpaced the broader market with an 8.83% gain, reaching an intraday high of Rs 1474.05. This 6.25 percentage-point outperformance over its sector signals a distinctly stock-specific rally rather than a mere market tailwind.
Read full news article Announcements
TBO Tek Limited Has Informed The Exchange Regarding The Name Change Of Wholly Owned Subsidiary.
11-Jun-2026 | Source : BSEPlease find enclosed the Intimation.
Announcement under Regulation 30 (LODR)-Earnings Call Transcript
04-Jun-2026 | Source : BSEPlease find enclosed the Transcript of the Investor Earnings Conference Call.
Investor Presentation
02-Jun-2026 | Source : BSEPlease find enclosed the Investor Presentation.
Corporate Actions

No Upcoming Board Meetings

No Dividend history available

No Splits history available

No Bonus history available

No Rights history available
Quality key factors
Valuation key factors
Technicals key factors
 Technical Indicator Scale: Bearish, Mildly Bearish, Sideways, Mildly Bullish, Bullish Turned
 Shareholding Snapshot : Mar 2026
Shareholding Compare (%holding)
Promoters
None
Held by 25 Schemes (17.63%)
Held by 79 FIIs (29.71%)
Lap Travel Private Limited (21.6%)
General Atlantic Singapore Tbo Pte. Ltd (14.4%)
3.08%
Quarterly Results Snapshot (Consolidated) - Mar'26 - QoQ

QoQ Growth in quarter ended Mar 2026 is 3.83% vs 38.21% in Dec 2025

QoQ Growth in quarter ended Mar 2026 is 11.94% vs -20.52% in Dec 2025
Half Yearly Results Snapshot (Consolidated) - Sep'25
Growth in half year ended Sep 2025 is 24.12% vs 24.72% in Sep 2024
Growth in half year ended Sep 2025 is 7.86% vs 16.15% in Sep 2024
Nine Monthly Results Snapshot (Consolidated) - Dec'25
YoY Growth in nine months ended Dec 2025 is 44.28% vs 26.14% in Dec 2024
YoY Growth in nine months ended Dec 2025 is 7.73% vs 9.91% in Dec 2024
Annual Results Snapshot (Consolidated) - Mar'26
YoY Growth in year ended Mar 2026 is 54.10% vs 24.74% in Mar 2025
YoY Growth in year ended Mar 2026 is 6.27% vs 13.72% in Mar 2025
About TBO Tek Ltd

Company Coordinates


