
Compare TCI Express with Similar Stocks
Dashboard
The company is Net-Debt Free
Poor long term growth as Net Sales has grown by an annual rate of -0.66% and Operating profit at -23.10% over the last 5 years
Flat results in Mar 26
With ROE of 10.1, it has a Expensive valuation with a 2.5 Price to Book Value
Majority shareholders : Promoters
Consistent Underperformance against the benchmark over the last 3 years
Stock DNA
Transport Services
INR 2,073 Cr (Small Cap)
24.00
37
1.67%
-0.09
10.14%
2.53
Total Returns (Price + Dividend) 
Latest dividend: 6.96331615120275 per share ex-dividend date: Feb-06-2026
Risk Adjusted Returns v/s
Returns Beta

News
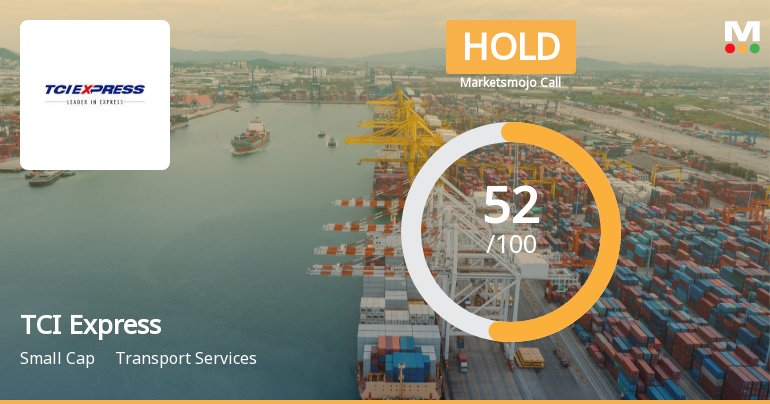
MarketsMOJO Upgrades TCI Express Ltd to Hold on Technical Improvement
TCI Express Ltd, a small-cap player in the transport services sector, has seen its investment rating upgraded from Sell to Hold as of 22 June 2026. This change reflects a nuanced assessment across four key parameters: quality, valuation, financial trend, and technicals. While the company’s recent financial performance remains flat, technical indicators have shown signs of mild bullishness, prompting a reassessment of its outlook.
Read full news article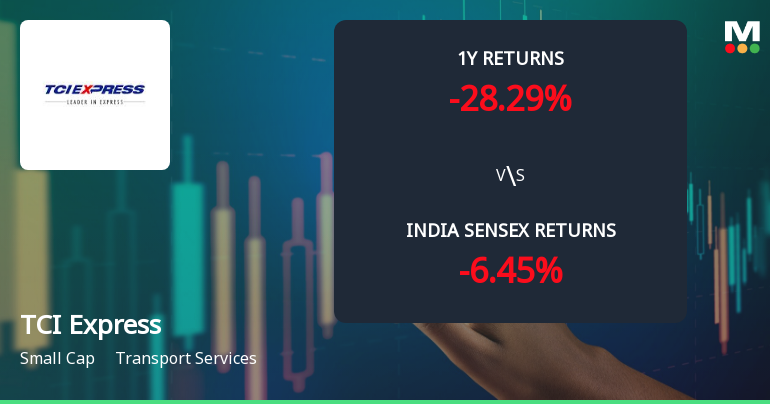
TCI Express Ltd Technical Momentum Shifts Signal Mild Bullish Outlook
TCI Express Ltd, a small-cap player in the transport services sector, has witnessed a subtle but meaningful shift in its technical momentum, moving from a sideways trend to a mildly bullish stance. This change is underscored by a combination of weekly and monthly technical indicators, including MACD, KST, and Dow Theory signals, suggesting cautious optimism for investors despite mixed moving average and Bollinger Band readings.
Read full news article
TCI Express Ltd Technical Momentum Shifts Amid Mixed Market Returns
TCI Express Ltd has exhibited a nuanced shift in its technical momentum, transitioning from a mildly bearish stance to a sideways trend, reflecting a complex interplay of indicator signals. Despite a modest day gain of 1.81%, the stock’s broader technical and fundamental outlook remains cautious, underscored by a recent downgrade in its Mojo Grade to Sell from Hold.
Read full news article Announcements
Announcement under Regulation 30 (LODR)-Newspaper Publication
19-Jun-2026 | Source : BSENewspaper Cuttings - Publication of Second 100 Days Saksham Niveshak Compaign and Special Window for re-lodgemnet of physical shares transfer request
Announcement under Regulation 30 (LODR)-Earnings Call Transcript
04-Jun-2026 | Source : BSETranscript of Quarter4/FY 25-26 regarding submission of audio recording held with investors to discuss the audited financial results
Announcement under Regulation 30 (LODR)-Analyst / Investor Meet - Outcome
29-May-2026 | Source : BSEAudit Recording of Con-Call-Q4FY 2025-26
Corporate Actions

No Upcoming Board Meetings

TCI Express Ltd has declared 350% dividend, ex-date: 06 Feb 26

No Splits history available

No Bonus history available

No Rights history available
Quality key factors
Valuation key factors
Technicals key factors
 Technical Indicator Scale: Bearish, Mildly Bearish, Sideways, Mildly Bullish, Bullish Turned
 Shareholding Snapshot : Mar 2026
Shareholding Compare (%holding)
Promoters
None
Held by 7 Schemes (9.39%)
Held by 24 FIIs (0.81%)
Tci Express Consolidated Limited (44.4%)
Hdfc Large And Mid Multi Cap Fund (4.04%)
14.84%
Quarterly Results Snapshot (Consolidated) - Mar'26 - YoY

YoY Growth in quarter ended Mar 2026 is 6.77% vs -3.10% in Mar 2025
YoY Growth in quarter ended Mar 2026 is -17.20% vs -38.71% in Mar 2025
Half Yearly Results Snapshot (Consolidated) - Sep'25
Growth in half year ended Sep 2025 is -1.53% vs -3.25% in Sep 2024
Growth in half year ended Sep 2025 is -8.17% vs -30.44% in Sep 2024
Nine Monthly Results Snapshot (Consolidated) - Dec'25
YoY Growth in nine months ended Dec 2025 is 0.93% vs -3.81% in Dec 2024
YoY Growth in nine months ended Dec 2025 is -1.54% vs -33.64% in Dec 2024
Annual Results Snapshot (Consolidated) - Mar'26
YoY Growth in year ended Mar 2026 is 2.41% vs -3.63% in Mar 2025
YoY Growth in year ended Mar 2026 is -5.10% vs -34.84% in Mar 2025
About TCI Express Ltd

Company Coordinates


