
Compare TCI Finance with Similar Stocks
Stock DNA
Non Banking Financial Company (NBFC)
INR 27 Cr (Micro Cap)
7.00
20
0.00%
0.00
-5.19%
-0.29
Total Returns (Price + Dividend) 
TCI Finance for the last several years.
Risk Adjusted Returns v/s
Returns Beta

News

TCI Finance Ltd Locks at Upper Circuit With 19.98% Gain — Buyers Queue, Sellers Absent
At Rs 20.91, the buying was done — not because demand dried up, but because the exchange wouldn't let the stock go any higher. TCI Finance Ltd locked at its upper circuit of 19.98% on 09 Jun 2026, with buyers queuing and no sellers willing to part with shares.
Read full news article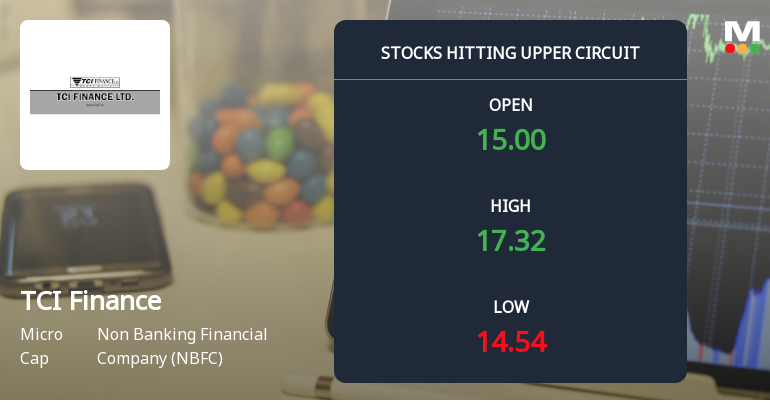
Micro-Cap TCI Finance Ltd Locks at Upper Circuit — Rs 0.92 Crore Turnover and Rising Delivery Tell the Story
At Rs 17.43, the buying was done — not because demand dried up, but because the exchange wouldn't let the stock go any higher. TCI Finance Ltd locked at its upper circuit of 19.96% on 8 Jun 2026, with buyers queuing and no sellers willing to part with shares, signalling strong unfilled demand in this micro-cap NBFC.
Read full news articleAre TCI Finance Ltd latest results good or bad?
The latest financial results for TCI Finance Ltd for Q4 FY26 reveal a complex picture of operational challenges and marginal profitability. The company reported a net profit of ₹0.11 crores, marking a turnaround from a loss in the previous quarter, yet this figure represents a significant decline of 83.30% year-over-year. Similarly, the operating profit (PBDIT) showed a sequential improvement to ₹0.23 crores from a loss of ₹0.28 crores in the prior quarter, but this is a stark drop of 94.92% compared to the same quarter last year, where it stood at ₹4.53 crores. A critical aspect of TCI Finance's performance is its reliance on other income, which amounted to ₹0.48 crores in the latest quarter. This income was essential for achieving profitability, as the core operations remain unprofitable, with an operating profit excluding other income reported at ₹-0.25 crores. The absence of any meaningful revenue gene...
Read full news article Announcements
Compliances-Reg.24(A)-Annual Secretarial Compliance
29-May-2026 | Source : BSEAnnual Secretarial Compliance Report for the year ended 31st March 2026
Announcement under Regulation 30 (LODR)-Newspaper Publication
27-May-2026 | Source : BSEPublication of audited results in the newspaper for the quarter and year ended 31st March 2026
Board Meeting Outcome for Outcome Of Board Meeting - Audited Results For The Quarter And Year Ended 31St March 2026
25-May-2026 | Source : BSEOutcome of Board Meeting - Audited Results for the quarter and year ended 31st March 2026
Corporate Actions

No Upcoming Board Meetings

No Dividend history available

No Splits history available

No Bonus history available

No Rights history available
Quality key factors
Valuation key factors
Technicals key factors
 Technical Indicator Scale: Bearish, Mildly Bearish, Sideways, Mildly Bullish, Bullish Turned
 Shareholding Snapshot : Mar 2026
Shareholding Compare (%holding)
Non Institution
None
Held by 0 Schemes
Held by 0 FIIs
Giri Roadlines And Commercial Trading Pvt. Ltd. (9.47%)
None
62.98%
Quarterly Results Snapshot (Standalone) - Mar'26 - QoQ
QoQ Growth in quarter ended Mar 2026 is 0.00% vs 0.00% in Dec 2025

QoQ Growth in quarter ended Mar 2026 is 110.09% vs -186.84% in Dec 2025
Half Yearly Results Snapshot (Standalone) - Sep'25
Growth in half year ended Sep 2025 is 0.00% vs -100.00% in Sep 2024
Growth in half year ended Sep 2025 is -12.68% vs -173.08% in Sep 2024
Nine Monthly Results Snapshot (Standalone) - Dec'25
YoY Growth in nine months ended Dec 2025 is 0.00% vs -100.00% in Dec 2024
YoY Growth in nine months ended Dec 2025 is -98.95% vs -9,600.00% in Dec 2024
Annual Results Snapshot (Standalone) - Mar'26
YoY Growth in year ended Mar 2026 is 0.00% vs -100.00% in Mar 2025

YoY Growth in year ended Mar 2026 is -149.72% vs 845.83% in Mar 2025
About TCI Finance Ltd

Company Coordinates


