
Compare TD Power Systems with Similar Stocks
Dashboard
Low Debt Company with Strong Long Term Fundamental Strength
- Healthy long term growth as Net Sales has grown by an annual rate of 25.61% and Operating profit at 47.15%
- The company is Net-Debt Free
- The company has been able to generate a Return on Capital Employed (avg) of 27.31% signifying high profitability per unit of total capital (equity and debt)
With a growth in Net Sales of 69.21%, the company declared Very Positive results in Mar 26
High Institutional Holdings at 50.06%
Company is among the highest 1% of companies rated by MarketsMojo across all 4,000 stocks
Stock DNA
Heavy Electrical Equipment
INR 16,326 Cr (Small Cap)
73.00
43
0.15%
-0.17
22.28%
16.21
Total Returns (Price + Dividend) 
Latest dividend: 1 per share ex-dividend date: Nov-06-2025
Risk Adjusted Returns v/s
Returns Beta

News
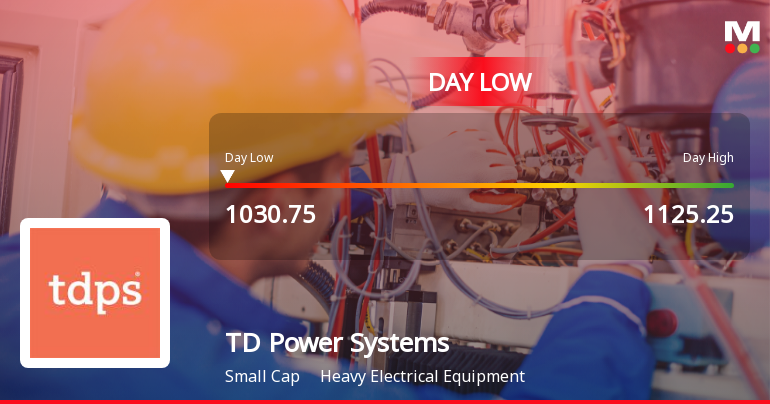
TD Power Systems Ltd Hits Intraday Low Amid Price Pressure on 29 Jul 2026
TD Power Systems Ltd experienced a notable decline today, touching an intraday low of Rs 1,030.75, reflecting a sharp price pressure of -7.34% as the stock underperformed its sector and broader market indices.
Read full news article
TD Power Systems Ltd is Rated Buy
TD Power Systems Ltd is rated 'Buy' by MarketsMOJO, with this rating last updated on 01 July 2026. However, the analysis and financial metrics discussed here reflect the company’s current position as of 24 July 2026, providing investors with the most up-to-date view of the stock’s fundamentals, returns, and technical outlook.
Read full news article
TD Power Systems Ltd is Rated Buy by MarketsMOJO
TD Power Systems Ltd is rated 'Buy' by MarketsMOJO, with this rating last updated on 01 July 2026. However, the analysis and financial metrics discussed here reflect the stock's current position as of 13 July 2026, providing investors with the most up-to-date view of the company’s fundamentals, returns, and technical outlook.
Read full news article Announcements
Announcement under Regulation 30 (LODR)-Newspaper Publication
18-Jul-2026 | Source : BSENewspaper Publication
Record Date For Final Dividend
17-Jul-2026 | Source : BSERecord Date for Final Dividend
Notice Of 27Th Annual General Meeting & Annual Report For FY 2025-26
17-Jul-2026 | Source : BSENotice of 27th Annual General Meeting & Annual Report for FY 2025-26
Corporate Actions

No Upcoming Board Meetings

TD Power Systems Ltd has declared 55% dividend, ex-date: 05 Aug 26

TD Power Systems Ltd has announced 2:10 stock split, ex-date: 31 Oct 22

No Bonus history available

No Rights history available
Quality key factors
Valuation key factors
Technicals key factors
 Technical Indicator Scale: Bearish, Mildly Bearish, Sideways, Mildly Bullish, Bullish Turned
 Shareholding Snapshot : Jun 2026
Shareholding Compare (%holding)
Promoters
None
Held by 23 Schemes (21.88%)
Held by 196 FIIs (26.18%)
Saphire Finman Services Llp (13.22%)
Nippon Life India Trustee Ltd-a/c Nippon India Small Cap Fund (6.5%)
17.69%
Quarterly Results Snapshot (Consolidated) - Mar'26 - YoY

YoY Growth in quarter ended Mar 2026 is 69.21% vs 31.95% in Mar 2025

YoY Growth in quarter ended Mar 2026 is 36.16% vs 82.64% in Mar 2025
Half Yearly Results Snapshot (Consolidated) - Sep'25
Growth in half year ended Sep 2025 is 42.07% vs 17.45% in Sep 2024
Growth in half year ended Sep 2025 is 43.92% vs 28.92% in Sep 2024
Nine Monthly Results Snapshot (Consolidated) - Dec'25
YoY Growth in nine months ended Dec 2025 is 36.16% vs 26.33% in Dec 2024
YoY Growth in nine months ended Dec 2025 is 37.05% vs 36.07% in Dec 2024
Annual Results Snapshot (Consolidated) - Mar'26
YoY Growth in year ended Mar 2026 is 45.16% vs 27.81% in Mar 2025
YoY Growth in year ended Mar 2026 is 36.77% vs 47.51% in Mar 2025
About TD Power Systems Ltd

Company Coordinates


