
Compare Terai Tea Co with Similar Stocks
Dashboard
With a Operating Losses, the company has a Weak Long Term Fundamental Strength
- Poor long term growth as Net Sales has grown by an annual rate of 4.42% and Operating profit at 6.10% over the last 5 years
- Company's ability to service its debt is weak with a poor EBIT to Interest (avg) ratio of -1.56
Flat results in Mar 26
Risky - Negative EBITDA
Underperformed the market in the last 1 year
Total Returns (Price + Dividend) 
Terai Tea Co for the last several years.
Risk Adjusted Returns v/s
Returns Beta

News
Are Terai Tea Co Ltd latest results good or bad?
Terai Tea Co Ltd's financial results for the quarter ending March 2026 present a complex picture of operational performance. The company reported net sales of ₹33.14 crores, reflecting a substantial sequential growth of 196.16% from the previous quarter's ₹11.19 crores and a year-on-year increase of 79.72% from ₹18.44 crores. This surge in revenue is notable, particularly as it coincides with the peak production season for tea estates. However, despite the impressive sales figures, the company's profitability remains a significant concern. Terai Tea recorded a net profit of ₹0.79 crores, which, while an improvement from a loss of ₹4.97 crores in the same quarter last year, represents a decline of 65.04% compared to the previous quarter's profit of ₹2.26 crores. This profit was heavily influenced by other income, which amounted to ₹8.26 crores and constituted 318.92% of profit before tax, raising questions ...
Read full news article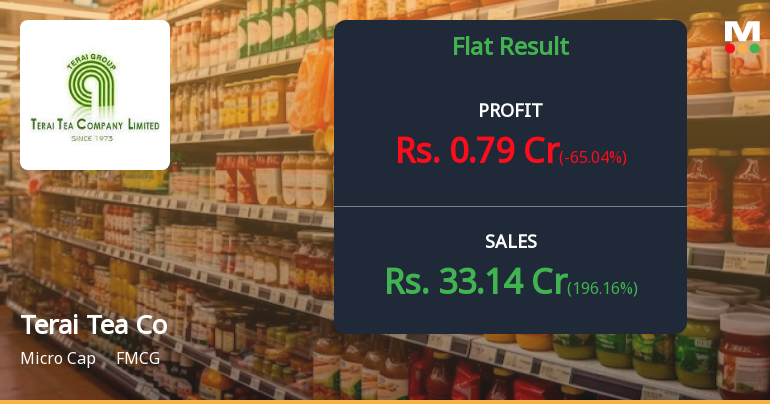
Terai Tea Co Q4 FY26: Profit Surge Masks Underlying Operational Weakness
Terai Tea Company Limited posted a consolidated net profit of ₹0.79 crores in Q4 FY26, a dramatic reversal from the ₹4.97 crores loss recorded in the same quarter last year. However, the quarterly result declined 65.04% sequentially from ₹2.26 crores in Q3 FY26, whilst the stock has plunged 42.69% over the past year, significantly underperforming the broader market. With a market capitalisation of ₹78.00 crores, the micro-cap tea producer faces mounting operational challenges despite the quarterly profit turnaround.
Read full news article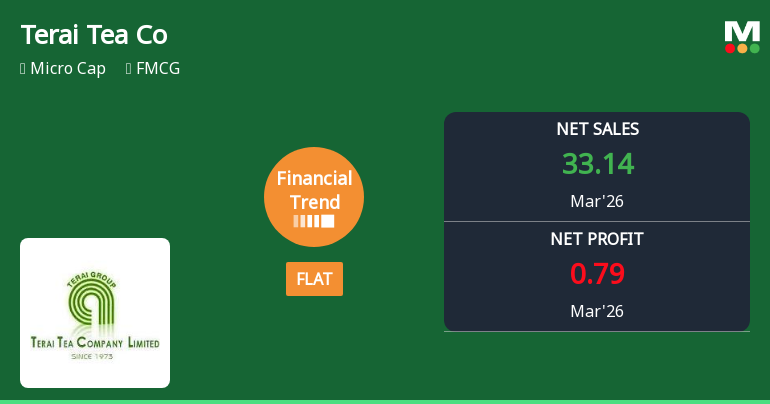
Terai Tea Co Ltd Reports Stabilised Quarterly Performance Amid Challenging Market Conditions
Terai Tea Co Ltd’s latest quarterly results for March 2026 reveal a stabilisation in financial performance after a period of decline, with net sales reaching a quarterly high of ₹33.14 crores and profit after tax (PAT) improving to ₹3.05 crores over the last six months. However, the company continues to face challenges with year-to-date sales and PAT contracting by nearly 30%, reflecting ongoing pressures in the FMCG sector and raising questions about sustainable growth prospects.
Read full news article Announcements
Announcement under Regulation 30 (LODR)-Newspaper Publication
01-Jun-2026 | Source : BSEPlease find the enclosed attachment.
Audited Financial Results Of The Company For The Quarter And Year Ended 31St March 2026
30-May-2026 | Source : BSEPlease find the enclosed attachment.
Re-Appointment Of Internal Auditor.
30-May-2026 | Source : BSERe-appointment of Internal Auditor
Corporate Actions

No Upcoming Board Meetings

No Dividend history available

No Splits history available

No Bonus history available

No Rights history available
Quality key factors
Valuation key factors
Technicals key factors
 Technical Indicator Scale: Bearish, Mildly Bearish, Sideways, Mildly Bullish, Bullish Turned
 Shareholding Snapshot : Mar 2026
Shareholding Compare (%holding)
Promoters
None
Held by 0 Schemes
Held by 0 FIIs
Ajit Kumar Agarwala (37.46%)
Rangan Projects Private Limited (5.78%)
8.64%
Quarterly Results Snapshot (Consolidated) - Mar'26 - QoQ

QoQ Growth in quarter ended Mar 2026 is 196.16% vs -26.96% in Dec 2025

QoQ Growth in quarter ended Mar 2026 is -65.04% vs 177.40% in Dec 2025
Half Yearly Results Snapshot (Consolidated) - Sep'25
Growth in half year ended Sep 2025 is -10.27% vs 125.33% in Sep 2024
Growth in half year ended Sep 2025 is -84.85% vs 572.73% in Sep 2024
Nine Monthly Results Snapshot (Consolidated) - Dec'25
YoY Growth in nine months ended Dec 2025 is -34.28% vs 35.06% in Dec 2024
YoY Growth in nine months ended Dec 2025 is -69.70% vs 212.28% in Dec 2024
Annual Results Snapshot (Consolidated) - Mar'26
YoY Growth in year ended Mar 2026 is -13.87% vs -4.69% in Mar 2025
YoY Growth in year ended Mar 2026 is -45.65% vs 93.31% in Mar 2025
About Terai Tea Co Ltd

Company Coordinates


