
 Price Point
Compare Thirumalai Chem. with Similar Stocks
ScoreDashboard
Weak Long Term Fundamental Strength with a -175.46% CAGR growth in Operating Profits over the last 5 years
- Low ability to service debt as the company has a high Debt to EBITDA ratio of -55.32 times
- The company has been able to generate a Return on Equity (avg) of 6.69% signifying low profitability per unit of shareholders funds
Negative results in Jun 26
Risky - Negative Operating Profits
Below par performance in long term as well as near term
Mojo ParametersStock DNA

Commodity Chemicals

INR 1,904 Cr (Small Cap)

NA (Loss Making)
43

0.00%

1.22

-10.23%

1.21
Total ReturnsTotal Returns (Price + Dividend) 
Latest dividend: 1 per share ex-dividend date: Jul-16-2024
Risk Adjusted Returns v/s
Returns Beta
 News & Corporate Actions
News
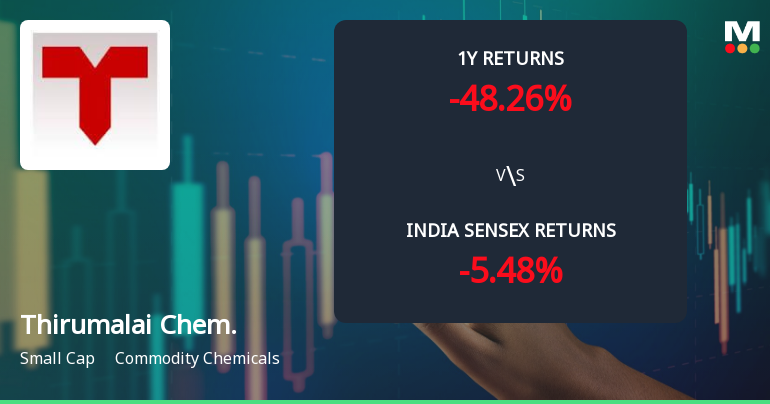
Thirumalai Chemicals Ltd Faces Intensified Bearish Momentum Amid Technical Downgrade
Thirumalai Chemicals Ltd, a small-cap player in the commodity chemicals sector, has seen its technical indicators shift decisively towards bearish territory, signalling increased downward momentum. The stock’s recent performance, coupled with deteriorating moving averages and momentum oscillators, paints a challenging outlook for investors amid broader market pressures.
Read full news article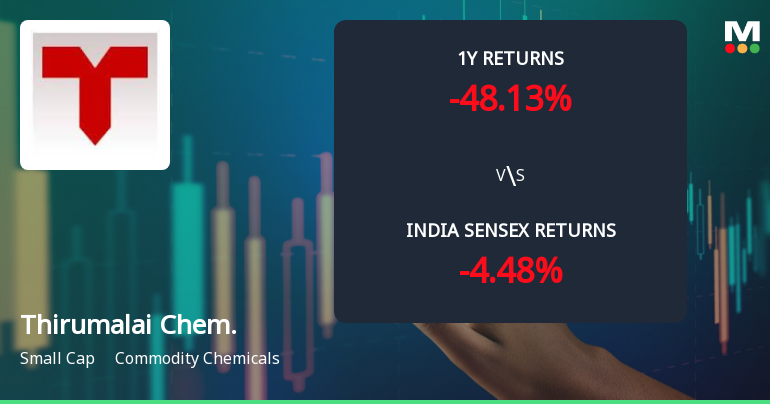
Thirumalai Chemicals Ltd Technical Momentum Shifts Amid Bearish Sentiment
Thirumalai Chemicals Ltd, a small-cap player in the commodity chemicals sector, has exhibited a nuanced shift in its technical momentum, reflecting a complex interplay of bearish and mildly bullish signals. Despite a marginal day gain of 0.25%, the stock’s broader technical indicators reveal a cautious outlook, underscored by a recent downgrade to a Strong Sell rating by MarketsMOJO.
Read full news article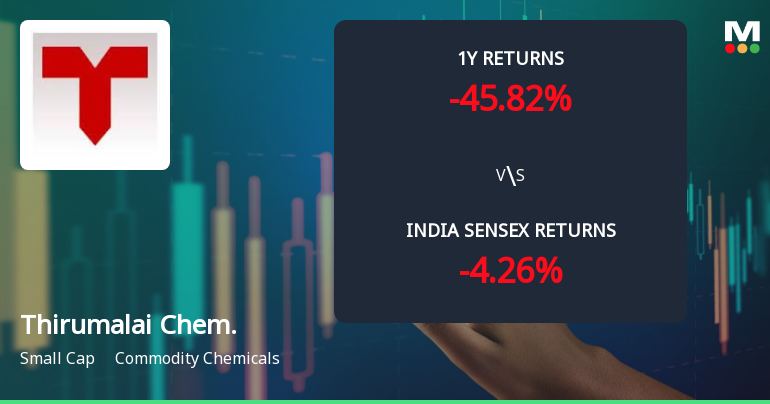
Thirumalai Chemicals Ltd Faces Bearish Momentum Amid Technical Downgrade
Thirumalai Chemicals Ltd, a small-cap player in the commodity chemicals sector, is currently exhibiting a pronounced bearish momentum as multiple technical indicators signal a deteriorating trend. Despite a modest intraday price range between ₹158.00 and ₹162.80, the stock closed slightly lower at ₹159.45, reflecting a 0.31% decline from its previous close of ₹159.95. This technical shift comes amid a broader context of underperformance relative to benchmark indices and peers.
Read full news article Announcements
Thirumalai Chemicals Limited - Others
05-Nov-2019 | Source : NSEThirumalai Chemicals Limited has informed the Exchange that Pursuant to Regulation 23(9) of the SEBI (Listing Obligations and Disclosure (Requirements) (Amendments) Regulations, 2018, the Company submitted a copy of disclosure of Related party Transactions prepared on a consolidated basis for the half year ended September 30, 2019 in accordance with the applicable Accounting Standards.
Thirumalai Chemicals Limited - Updates
01-Nov-2019 | Source : NSEThirumalai Chemicals Limited has informed the Exchange regarding 'The Board at its meeting held on 31st October, 2019 accorded approval to invest, from time to time, an amount not exceeding USD 20 Million (US Dollars Twenty Million) in TCL Global BV, The Netherlands, a Wholly owned Subsidiary of the Company by way of equity to achieve its objective including to invest in its Subsidiaries if permitted by its objectives subject to necessary approvals as required. The investment will be financed thru banks/internal accruals. '.
Updates
26-Jul-2019 | Source : NSE
| Thirumalai Chemicals Limited has informed the Exchange regarding 'Updates'.The Board approved the proposal to set up a subsidiary to establish and operate a Food Ingredients Manufacturing facility (including Malic and Fumaric Acid) in the US, with a capacity of about 30,000 Metric Tons Per Year, to address the growing demand in the global market, including North America. |
Corporate Actions

No Upcoming Board Meetings

Thirumalai Chemicals Ltd has declared 100% dividend, ex-date: 16 Jul 24

Thirumalai Chemicals Ltd has announced 1:1 stock split, ex-date: 14 Aug 18

No Bonus history available

No Rights history available
Key FactorsQuality key factors
Valuation key factors
Technicals key factors
 Technical Indicator Scale: Bearish, Mildly Bearish, Sideways, Mildly Bullish, Bullish Turned Shareholding
Shareholding Snapshot : Jun 2026
Shareholding Compare (%holding)
Non Institution
None
Held by 3 Schemes (9.06%)
Held by 43 FIIs (1.46%)
Ultramarine And Pigments Ltd (18.23%)
Motilal Oswal Small Cap Fund (6.79%)
37.94%
FinancialQuarterly Results Snapshot (Consolidated) - Jun'26 - QoQ
 Compare with Peers
QoQ Growth in quarter ended Jun 2026 is 28.86% vs 2.02% in Mar 2026

QoQ Growth in quarter ended Jun 2026 is -55.96% vs 39.88% in Mar 2026

Half Yearly Results Snapshot (Consolidated) - Sep'25
Growth in half year ended Sep 2025 is -17.08% vs 1.42% in Sep 2024
Growth in half year ended Sep 2025 is -1,035.27% vs 114.62% in Sep 2024
Nine Monthly Results Snapshot (Consolidated) - Dec'25
YoY Growth in nine months ended Dec 2025 is -14.10% vs -1.94% in Dec 2024
YoY Growth in nine months ended Dec 2025 is -336.67% vs -74.89% in Dec 2024
Annual Results Snapshot (Consolidated) - Mar'26
YoY Growth in year ended Mar 2026 is -15.32% vs -1.61% in Mar 2025
YoY Growth in year ended Mar 2026 is -264.23% vs -18.85% in Mar 2025
 Company CV
About Thirumalai Chemicals Ltd

Company Coordinates










