Thomas Cook (I)

  • Market Cap: Small Cap
  • Industry: Tour, Travel Related Services
  • ISIN: INE332A01027
  • NSEID: THOMASCOOK
  • BSEID: 500413
INR
107.25
-1.2 (-1.11%)
BSENSE

Aug 31, 01:25 PM

BSE+NSE Vol: 4.45 lacs

  • Price Points
  • Score
  • Mojo Parameters
  • Total Return
  • News and Corporate Actions
  • Key factors
  • Shareholding
  • Financials
  • CompanyCV
stock-summaryPrice Point
High/Low

1Day

52 Week

Valuation
Technical
Day's Volume

CASH

4.45 lacs (-75.98%) Volume

Shareholding (Jun 2026)

FII

6.18%

Held by 71 FIIs

DII

6.63%

Held by 13 DIIs

Promoter

64.77%

Why is Thomas Cook (India) Ltd falling/rising?

31-Aug-2026

As of 30-Aug, Thomas Cook (India) Ltd's stock price is at 108.45, down 1.45% and has declined 3.73% over the past week, underperforming the Sensex. Despite being net-debt free and having long-term growth potential, recent negative financial results have contributed to a significant year-over-year decline of 38.88%.

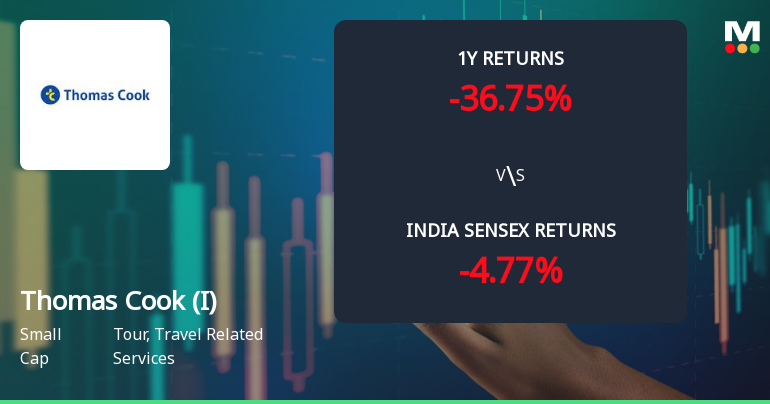
As of 30-Aug, Thomas Cook (India) Ltd's stock price is currently at 108.45, reflecting a decrease of 1.6, or 1.45%. The stock has been experiencing a downward trend, having fallen consecutively for the last two days, resulting in a total decline of 2.21% during this period. Over the past week, the stock has underperformed the benchmark Sensex, which has only decreased by 0.36%, while Thomas Cook's stock has dropped by 3.73%.<BR><BR>Investor participation has also declined, with the delivery volume on August 27 falling by 67.4% compared to the five-day average, indicating reduced interest from investors. Although the stock is trading above its 20-day, 50-day, and 100-day moving averages, it is below the 5-day and 200-day moving averages, suggesting a mixed technical outlook.<BR><BR>Despite some positive factors, such as the company being net-debt free and showing healthy long-term growth in net sales, the stock has significantly underperformed over the past year, with a return of -38.88% compared to the market's average return of 3.91%. Additionally, recent negative financial results, including a 37% decline in profit before tax compared to the previous four-quarter average, have contributed to the stock's downward movement. The combination of these factors has led to the current decline in Thomas Cook (India) Ltd's stock price.

View full answer

Who are in the management team of Thomas Cook (I)?

14-Aug-2026

The management team of Thomas Cook (I) includes Executive Chairman Madhavan Menon, Managing Director & CEO Mahesh Iyer, and several Non-Executive and Independent Non-Executive Directors, responsible for the company's strategic direction and operations.

The management team of Thomas Cook (I) includes the following individuals:<BR><BR>1. **Madhavan Menon** - Executive Chairman<BR>2. **Mahesh Iyer** - Managing Director & CEO<BR>3. **Sumit Maheshwari** - Non-Executive Director<BR>4. **Chandran Ratnaswami** - Non-Executive Director<BR>5. **Gopalakrishnan Sundarajan** - Non-Executive Director<BR>6. **K J Udeshi** - Independent Non-Executive Director<BR>7. **Sunil Behari Mathur** - Independent Non-Executive Director<BR>8. **Nilesh Vikamsey** - Independent Non-Executive Director<BR>9. **Pravir Vohra** - Independent Non-Executive Director<BR>10. **Sharmila Karve** - Independent Non-Executive Director<BR><BR>This team is responsible for guiding the company's strategic direction and operations.

View full answer

What does Thomas Cook (I) do?

14-Aug-2026

Thomas Cook (India) Ltd is a Small Cap company in the Tour and Travel Related Services industry, reporting net sales of ₹2,092 Cr and a net profit of ₹72 Cr for June 2026. The company, established in 1978, has a market cap of ₹5,153 Cr and key metrics include a P/E of 23.00 and a dividend yield of 0.42%.

Overview:<BR>Thomas Cook (India) Ltd operates in the Tour and Travel Related Services industry and is categorized as a Small Cap company.<BR><BR>History:<BR>The company was incorporated in 1978 as 'Thomas Cook (India) Private Limited' and later changed its name to Thomas Cook (India) Limited in 1979. The latest quarterly results reported net sales and profit for June 2026.<BR><BR>Financial Snapshot:<BR>- Net Sales: 2,092 Cr (Quarterly Results - Jun 2026)<BR>- Net Profit: 72 Cr (Quarterly Results - Jun 2026)<BR>- Market Cap: INR 5,153 Cr (Small Cap)<BR><BR>Key Metrics:<BR>- P/E: 23.00<BR>- Industry P/E: 37<BR>- Dividend Yield: 0.42%<BR>- Debt Equity: -0.32<BR>- Return on Equity: 8.88%<BR>- Price to Book: 1.97<BR><BR>Contact Details:<BR>Address: Thomas Cook Building, Dr Dadabhai Naoroji Road Fort Mumbai Maharashtra : 400001<BR>Tel: 91-22-4242 7000<BR>Email: sharedept@in.thomascook.com<BR>Website: http://www.thomascook.in

View full answer

Who are the peers of the Thomas Cook (I)?

14-Aug-2026

Peers of Thomas Cook (I) include I R C T C, TBO Tek, BLS International, and others. Management risk varies from excellent at I R C T C to below average at Yatra Online, with Thomas Cook (I) showing average risk and a 1-year return of -31.64%.

Peers: The peers of Thomas Cook (I) are I R C T C, TBO Tek, BLS Internat., Le Travenues, Easy Trip Plann., Yatra Online, Intl. Travel Hse, Wise Travel, Voler Car, and Party Cruisers.<BR><BR>Quality Snapshot: Excellent management risk is observed at I R C T C and Wise Travel, while Good management risk is found at TBO Tek and Party Cruisers, and Average management risk is noted at BLS Internat., Le Travenues, Thomas Cook (I), Easy Trip Plann., Yatra Online, Intl. Travel Hse, and Voler Car. Below Average management risk is present at Yatra Online and Voler Car. Growth is Excellent at BLS Internat. and Wise Travel, Good at TBO Tek, Thomas Cook (I), Le Travenues, and Voler Car, Average at Yatra Online and Intl. Travel Hse, and Below Average at Easy Trip Plann. Capital Structure is Excellent at I R C T C, TBO Tek, BLS Internat., Le Travenues, Easy Trip Plann., and Intl. Travel Hse, Good at Thomas Cook (I), Yatra Online, Wise Travel, and Voler Car.<BR><BR>Return Snapshot: The peer with the highest 1-year return is TBO Tek at 11.16%, while the lowest is I R C T C at -30.68%. Thomas Cook (I) has a 1-year return of -31.64%, which is lower than TBO Tek's return but higher than I R C T C's. Additionally, the peers with negative six-month returns include I R C T C, Le Travenues, Easy Trip Plann., Yatra Online, Intl. Travel Hse, and BLS Internat.

View full answer

How big is Thomas Cook (I)?

14-Aug-2026

As of 14th August, Thomas Cook (India) Ltd has a market capitalization of 4,983.68 Cr, with recent net sales of 8,082.10 Cr and a net profit of 218.70 Cr over the last four quarters.

As of 14th August, <BR><BR>Market Cap: Thomas Cook (India) Ltd has a market capitalization of 4,983.68 Cr, categorizing it as a Small Cap company.<BR><BR>Recent Quarterly Performance: The sum of Net Sales for the latest 4 quarters is 8,082.10 Cr, while the sum of Net Profit for the same period is 218.70 Cr.<BR><BR>Balance Sheet Snapshot: The reporting period for the latest annual data is March 2025. Shareholder's Funds stand at 2,259.61 Cr, and Total Assets amount to 6,914.05 Cr.

View full answer

Are Thomas Cook (India) Ltd latest results good or bad?

04-Aug-2026

Thomas Cook (India) Ltd's latest results show strong sequential growth with a net profit increase of 85.98% and an 18.14% rise in revenue compared to the previous quarter. However, year-on-year performance is concerning, with a 13.13% revenue decline and reliance on non-operating income, indicating potential challenges ahead.

The latest results for Thomas Cook (India) Ltd present a mixed picture. On one hand, the company reported a consolidated net profit of ₹71.90 crores for Q1 FY27, which is an impressive 85.98% increase compared to the previous quarter. Additionally, revenue rose by 18.14% quarter-on-quarter to ₹2,091.89 crores. These sequential improvements indicate a recovery from the traditionally weaker Q4 FY26.<BR><BR>However, when looking at the year-on-year performance, the situation is concerning. The revenue has declined by 13.13% compared to the same quarter last year, and the net profit shows a slight decrease of 0.21% year-on-year. This decline in revenue is particularly troubling given the overall recovery in the travel industry post-pandemic.<BR><BR>Furthermore, a significant portion of the profit (68.93% of profit before tax) came from non-operating income, raising questions about the sustainability of these earnings. The operating margin, although stable at 4.45%, has decreased by 80 basis points from the previous year, reflecting ongoing operational challenges.<BR><BR>Overall, while the sequential growth is a positive sign, the year-on-year decline and reliance on non-operating income suggest that the company is facing deeper structural issues. Investors may view these results as indicative of both potential recovery and significant challenges ahead.

View full answer

Should I buy, sell or hold Thomas Cook (India) Ltd?

04-Aug-2026

When is the next results date for Thomas Cook (India) Ltd?

28-Apr-2026

The next results date for Thomas Cook (India) Ltd is 12 May 2026.

The next results date for Thomas Cook (India) Ltd is scheduled for 12 May 2026.

View full answer

Is Thomas Cook (I) overvalued or undervalued?

28-Nov-2025

As of November 27, 2025, Thomas Cook (I) is considered undervalued with an attractive valuation grade, a PE ratio of 28.86, and strong growth potential indicated by a PEG ratio of 0.00, despite a year-to-date return of -24.44% compared to the Sensex's 9.70%, while showing a robust long-term gain of 95.70% over three years.

As of 27 November 2025, the valuation grade for Thomas Cook (I) has moved from fair to attractive, indicating a positive shift in its market perception. The company is currently considered undervalued. Key ratios include a PE ratio of 28.86, an EV to EBITDA of 14.01, and a ROCE of 17.63%. <BR><BR>In comparison to its peers, Thomas Cook (I) shows a more favorable valuation than I R C T C, which has a PE ratio of 41.28, and Yatra Online, with a PE of 48.00. Notably, the PEG ratio for Thomas Cook stands at 0.00, suggesting strong growth potential relative to its price. While the stock has underperformed against the Sensex in the short term, with a year-to-date return of -24.44% compared to the Sensex's 9.70%, its long-term performance over three years shows a robust gain of 95.70%.

View full answer

Is Thomas Cook (I) technically bullish or bearish?

28-Nov-2025

As of November 27, 2025, Thomas Cook (I) shows a mildly bearish trend, supported by bearish signals from the weekly and monthly MACD and KST, despite some conflicting indicators on daily moving averages.

As of 27 November 2025, the technical trend for Thomas Cook (I) has changed from sideways to mildly bearish. The current technical stance is mildly bearish, driven by the weekly MACD and KST both indicating bearish signals, while the monthly MACD and KST are mildly bearish as well. The Bollinger Bands are bearish on both weekly and monthly time frames. Although the daily moving averages show a mildly bullish stance, this is countered by the weekly OBV being mildly bearish and the Dow Theory indicating a mildly bullish trend on the weekly but mildly bearish on the monthly. Overall, the combination of these indicators suggests a bearish sentiment in the current market environment.

View full answer

How has been the historical performance of Thomas Cook (I)?

13-Nov-2025

Thomas Cook (I) has shown significant recovery and growth from March 2021 to March 2025, with net sales increasing from 795.00 Cr to 8,139.57 Cr and a turnaround from losses to profits in operating profit, profit before tax, and profit after tax. Total liabilities and assets both rose, while cash flow from operating activities reached 717.00 Cr in March 2025.

Answer:<BR>The historical performance of Thomas Cook (I) shows a significant recovery and growth trajectory over the years, particularly from March 2021 to March 2025.<BR><BR>Breakdown:<BR>Thomas Cook (I) has demonstrated a notable increase in net sales, rising from 795.00 Cr in March 2021 to 8,139.57 Cr in March 2025. This growth is reflected in total operating income, which also increased from 1,888.25 Cr in March 2022 to 8,139.57 Cr in March 2025. The company has improved its operating profit, moving from a loss of 353.20 Cr in March 2021 to a profit of 621.66 Cr in March 2025. Profit before tax has followed a similar trend, climbing from a loss of 416.44 Cr in March 2021 to a profit of 378.36 Cr in March 2025. Profit after tax also improved significantly, from a loss of 295.18 Cr in March 2021 to a profit of 254.61 Cr in March 2025. The company's total liabilities increased from 4,518.64 Cr in March 2021 to 6,914.05 Cr in March 2025, while total assets rose from 4,518.64 Cr to 6,914.05 Cr in the same period. Cash flow from operating activities has been positive, reaching 717.00 Cr in March 2025, despite fluctuations in cash flow from investing and financing activities. Overall, Thomas Cook (I) has shown a strong recovery and growth in financial performance over the past few years.

View full answer

Who are the top shareholders of the Thomas Cook (I)?

17-Jul-2025

The top shareholders of Thomas Cook (I) include Fairbridge Capital Mauritius Limited with 63.83%, mutual funds holding 6.9%, foreign institutional investors at 4.52%, and individual investors at 17.49%. The largest public shareholder is Nippon Life India Trustee Ltd with a 2.9% stake.

The top shareholders of Thomas Cook (I) include Fairbridge Capital Mauritius Limited, which holds a significant 63.83% of the shares, making it the largest promoter. Other notable shareholders include mutual funds, which collectively hold 6.9% through 15 schemes, and foreign institutional investors (FIIs) who hold 4.52% across 123 entities. The highest public shareholder is Nippon Life India Trustee Ltd, managing the Nippon India Focused Equity Fund, with a holding of 2.9%. Additionally, individual investors account for 17.49% of the shareholding.

View full answer

Has Thomas Cook (I) declared dividend?

06-Jun-2025

Yes, Thomas Cook (India) Ltd has declared a 40% dividend, amounting to ₹0.2 per share, with an ex-date of August 16, 2024. While recent total returns over shorter periods have been negative, the company has shown significant growth in total returns over the longer term, particularly in the last 2 to 5 years.

Thomas Cook (India) Ltd has declared a 40% dividend.<BR><BR>Dividend Details:<BR>- Percentage announced: 40%<BR>- Amount per share: 0.2<BR>- Ex-date: 16 Aug 24<BR><BR>Dividend Yield: 0.34%.<BR><BR>Total Returns by Period:<BR>In the last 6 months, the price return was -21.64%, with a dividend return of 0%, resulting in a total return of -21.64%.<BR><BR>Over the past year, the price return was -17.55%, with a dividend return of 0.09%, leading to a total return of -17.46%.<BR><BR>In the 2-year period, the price return was 151.11%, with a dividend return of 0.79%, culminating in a total return of 151.9%.<BR><BR>For the 3-year period, the price return was 170.68%, with a dividend return of 1.06%, resulting in a total return of 171.74%.<BR><BR>In the last 4 years, the price return was 147.59%, with a dividend return of 0.91%, leading to a total return of 148.5%.<BR><BR>Over the past 5 years, the price return was 454.16%, with a dividend return of 2.17%, resulting in a total return of 456.33%.<BR><BR>Overall, while Thomas Cook (India) Ltd has declared a dividend, the recent total returns over shorter periods have been negative, indicating challenges in the company's performance. However, the longer-term returns show significant growth, particularly over 2 to 5 years.

View full answer
iScoreScore
Click here to find our call on this stock
Strong Sell
Sell
Hold
Buy
Strong Buy

Dashboard

1

Negative results in Jun 26

  • PBT LESS OI(Q) At Rs 27.55 cr has Fallen at -37.0% (vs previous 4Q average)
  • ROCE(HY) Lowest at 13.91%
  • NON-OPERATING INCOME(Q) is 68.93 % of Profit Before Tax (PBT)
2

Underperformed the market in the last 1 year

stock-summaryMojo Parameters

Mojo Parameters

Loading Valuation Snapshot...

Stock DNA

stock-summary
Industry

Tour, Travel Related Services

stock-summary
Market cap

INR 5,045 Cr (Small Cap)

stock-summary
P/E

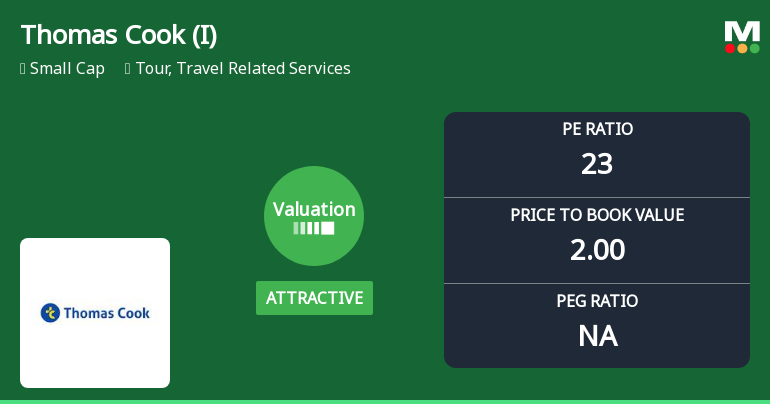
23.00

stock-summary
Industry P/E

36

stock-summary
Dividend Yield

0.46%

stock-summary
Debt Equity

-0.32

stock-summary
Return on Equity

8.88%

stock-summary
Price to Book

2.00

Revenue and Profits:
Net Sales:
2,092 Cr
(Quarterly Results - Jun 2026)
Net Profit:
72 Cr
stock-summaryTotal Returns
Total Returns (Price + Dividend) stock-summary
Dividend Yield (0.46%)
TimePeriod
Price Return
Dividend Return
Total Return
3 Months
18.57%
0.55%
19.12%
6 Months
7.46%
0.52%
7.98%
1 Year
-39.59%
0.28%
-39.31%
2 Years
-53.37%
0.44%
-52.93%
3 Years
-6.14%
0.95%
-5.19%
4 Years
46.92%
2.11%
49.03%
5 Years
81.93%
2.35%
84.28%

Latest dividend: 0.500910332271279 per share ex-dividend date: Aug-27-2026

Risk Adjusted Returns v/s stock-summary
Returns Beta
Icon
Beta has not been calculated since enough price history is not available
stock-summaryNews & Corporate Actions

News

Thomas Cook (India) Ltd Falls 3.73%: 4 Key Factors Driving the Weekly Decline

Announcements stock-summary

Announcement under Regulation 30 (LODR)-Press Release / Media Release

28-Aug-2026 | Source : BSE

We are enclosing herewith the Press Release of M/s. Sterling Holiday Resorts Limited wholly owned subsidiary of M/s. Thomas Cook (India) Limited dated August 28 2026 titled "Sterling Puts Bastar on the Travellers Maps with its 80th Resort".

Announcement under Regulation 30 (LODR)-Press Release / Media Release

27-Aug-2026 | Source : BSE

We are enclosing herewith the Press Release of M/s. Sterling Holiday Resorts Limited wholly owned subsidiary of M/s. Thomas Cook (India) Limited dated August 27 2026 titled "Sterling Expands its Kumaon Circuit with Sterling Lake View Sattal".

Announcement under Regulation 30 (LODR)-Press Release / Media Release

25-Aug-2026 | Source : BSE

We are enclosing herewith the Press Release dated August 25 2026 titled "Thomas Cook India & SOTC Travel Curate unique experiential Fall & Winter journeys across Europe North America Australia & New Zealand".

Corporate Actions stock-summary

stock-summary
BOARD MEETING

No Upcoming Board Meetings

stock-summary
DIVIDEND

Thomas Cook (India) Ltd has declared 50% dividend, ex-date: 27 Aug 26

stock-summary
SPLITS

Thomas Cook (India) Ltd has announced 1:10 stock split, ex-date: 14 May 07

stock-summary
BONUS

No Bonus history available

stock-summary
RIGHTS

Thomas Cook (India) Ltd has announced 35:100 rights issue, ex-date: 19 Dec 08

stock-summaryKey Factors

Quality key factors stock-summary

Factor
Value
Sales Growth (5y)
51.94%
EBIT Growth (5y)
19.93%
EBIT to Interest (avg)
1.62
Debt to EBITDA (avg)
1.31
Net Debt to Equity (avg)
-0.32
Sales to Capital Employed (avg)
2.25
Tax Ratio
31.34%
Dividend Payout Ratio
10.75%
Pledged Shares
0
Institutional Holding
12.80%
ROCE (avg)
8.62%
ROE (avg)
6.68%

Valuation key factors

Factor
Value
P/E Ratio
23
Industry P/E
36
Price to Book Value
2.00
EV to EBIT
18.64
EV to EBITDA
10.82
EV to Capital Employed
2.48
EV to Sales
0.53
PEG Ratio
NA
Dividend Yield
0.46%
ROCE (Latest)
15.58%
ROE (Latest)
8.88%

Technicals key factors

Indicator
Weekly
Monthly
MACD
Mildly Bullish
Bearish
RSI
Bearish
Bullish
Bollinger Bands
Mildly Bullish
Mildly Bearish
Moving Averages
Mildly Bearish (Daily)
KST
Bullish
Bearish
Dow Theory
Mildly Bullish
Mildly Bullish
OBV
Bullish
Bullish
stock-summary Technical Indicator Scale: Bearish, Mildly Bearish, Sideways, Mildly Bullish, Bullish  Turned 
stock-summaryShareholding
Shareholding Snapshot : Jun 2026stock-summary
Shareholding Compare (%holding) stock-summary
Majority shareholders

Promoters

Pledged Promoter Holdings

None

Mutual Funds

Held by 10 Schemes (6.02%)

FIIs

Held by 71 FIIs (6.18%)

Promoter with highest holding

Fairbridge Capital Mauritius Limited (64.77%)

Highest Public shareholder

Government Pension Fund Global (3.39%)

Individual Investors Holdings

17.35%

stock-summaryFinancial
[
  {
    "link": "quarterly",
    "btn_text": "All Quarterly Results",
    "header": "Quarterly Results Snapshot (Consolidated) - Jun'26 - QoQ",
    "rhs": [
      {
        "prefix": "Net Sales ",
        "suffix": "QoQ Growth in quarter ended Jun 2026 is 18.14% vs -17.48% in Mar 2026",
        "dir": 1
      },
      {
        "prefix": "Consolidated Net Profit ",
        "suffix": "QoQ Growth in quarter ended Jun 2026 is 85.98% vs -7.29% in Mar 2026",
        "dir": 1
      }
    ],
    "table": {
      "header": [
        "Jun'26",
        "Mar'26",
        "Change(%)"
      ],
      "body": [
        {
          "field": "Net Sales",
          "val1": "2,091.89",
          "val2": "1,770.69",
          "chgp": "18.14%",
          "chgp_class": "positive"
        },
        {
          "field": "Operating Profit (PBDIT) excl Other Income",
          "val1": "93.03",
          "val2": "78.36",
          "chgp": "18.72%",
          "chgp_class": "positive"
        },
        {
          "field": "Interest",
          "val1": "23.49",
          "val2": "23.04",
          "chgp": "1.95%",
          "chgp_class": "negative"
        },
        {
          "field": "Exceptional Items",
          "val1": "-0.20",
          "val2": "-1.54",
          "chgp": "87.01%",
          "chgp_class": "positive"
        },
        {
          "field": "Consolidate Net Profit",
          "val1": "71.90",
          "val2": "38.66",
          "chgp": "85.98%",
          "chgp_class": "positive"
        },
        {
          "field": "Operating Profit Margin (Excl OI)",
          "val1": "4.45%",
          "val2": "4.43%",
          "chgp": "0.02%",
          "chgp_class": "positive"
        }
      ]
    }
  },
  {
    "link": "half-yearly",
    "btn_text": "All Half Yearly Results",
    "header": "Half Yearly Results Snapshot (Consolidated) - Sep'25",
    "rhs": [
      {
        "prefix": "Net Sales ",
        "suffix": " Growth in half year ended Sep 2025 is 9.05% vs 9.81% in Sep 2024",
        "dir": -1
      },
      {
        "prefix": "Consolidated Net Profit ",
        "suffix": " Growth in half year ended Sep 2025 is -1.21% vs 16.84% in Sep 2024",
        "dir": -1
      }
    ],
    "table": {
      "header": [
        "Sep'25",
        "Sep'24",
        "Change(%)"
      ],
      "body": [
        {
          "field": "Net Sales",
          "val1": "4,481.80",
          "val2": "4,109.70",
          "chgp": "9.05%",
          "chgp_class": "positive"
        },
        {
          "field": "Operating Profit (PBDIT) excl Other Income",
          "val1": "234.72",
          "val2": "260.61",
          "chgp": "-9.93%",
          "chgp_class": "negative"
        },
        {
          "field": "Interest",
          "val1": "47.52",
          "val2": "45.12",
          "chgp": "5.32%",
          "chgp_class": "negative"
        },
        {
          "field": "Exceptional Items",
          "val1": "25.65",
          "val2": "0.00",
          "chgp": "",
          "chgp_class": "neutral"
        },
        {
          "field": "Consolidate Net Profit",
          "val1": "138.49",
          "val2": "140.18",
          "chgp": "-1.21%",
          "chgp_class": "negative"
        },
        {
          "field": "Operating Profit Margin (Excl OI)",
          "val1": "5.24%",
          "val2": "6.34%",
          "chgp": "-1.10%",
          "chgp_class": "negative"
        }
      ]
    }
  },
  {
    "link": "nine-monthly",
    "btn_text": "All Nine Monthly Results",
    "header": "Nine Monthly Results Snapshot (Consolidated) - Dec'25",
    "rhs": [
      {
        "prefix": "Net Sales ",
        "suffix": "YoY Growth in nine months ended Dec 2025 is 7.40% vs 9.50% in Dec 2024",
        "dir": -1
      },
      {
        "prefix": "Consolidated Net Profit ",
        "suffix": "YoY Growth in nine months ended Dec 2025 is -5.04% vs -6.23% in Dec 2024",
        "dir": 1
      }
    ],
    "table": {
      "header": [
        "Dec'25",
        "Dec'24",
        "Change(%)"
      ],
      "body": [
        {
          "field": "Net Sales",
          "val1": "6,627.48",
          "val2": "6,170.71",
          "chgp": "7.40%",
          "chgp_class": "positive"
        },
        {
          "field": "Operating Profit (PBDIT) excl Other Income",
          "val1": "349.19",
          "val2": "376.36",
          "chgp": "-7.22%",
          "chgp_class": "negative"
        },
        {
          "field": "Interest",
          "val1": "71.73",
          "val2": "71.07",
          "chgp": "0.93%",
          "chgp_class": "negative"
        },
        {
          "field": "Exceptional Items",
          "val1": "-4.45",
          "val2": "-3.71",
          "chgp": "-19.95%",
          "chgp_class": "negative"
        },
        {
          "field": "Consolidate Net Profit",
          "val1": "180.19",
          "val2": "189.76",
          "chgp": "-5.04%",
          "chgp_class": "negative"
        },
        {
          "field": "Operating Profit Margin (Excl OI)",
          "val1": "5.27%",
          "val2": "6.10%",
          "chgp": "-0.83%",
          "chgp_class": "negative"
        }
      ]
    }
  },
  {
    "link": "annual",
    "btn_text": "All Annual Results",
    "header": "Annual Results Snapshot (Consolidated) - Mar'26",
    "rhs": [
      {
        "prefix": "Net Sales ",
        "suffix": "YoY Growth in year ended Mar 2026 is 3.18% vs 11.51% in Mar 2025",
        "dir": -1
      },
      {
        "prefix": "Consolidated Net Profit ",
        "suffix": "YoY Growth in year ended Mar 2026 is -13.95% vs -1.81% in Mar 2025",
        "dir": -1
      }
    ],
    "table": {
      "header": [
        "Mar'26",
        "Mar'25",
        "Change(%)"
      ],
      "body": [
        {
          "field": "Net Sales",
          "val1": "8,398.17",
          "val2": "8,139.57",
          "chgp": "3.18%",
          "chgp_class": "positive"
        },
        {
          "field": "Operating Profit (PBDIT) excl Other Income",
          "val1": "427.55",
          "val2": "476.70",
          "chgp": "-10.31%",
          "chgp_class": "negative"
        },
        {
          "field": "Interest",
          "val1": "94.77",
          "val2": "94.60",
          "chgp": "0.18%",
          "chgp_class": "negative"
        },
        {
          "field": "Exceptional Items",
          "val1": "-5.99",
          "val2": "-6.82",
          "chgp": "12.17%",
          "chgp_class": "positive"
        },
        {
          "field": "Consolidate Net Profit",
          "val1": "218.85",
          "val2": "254.33",
          "chgp": "-13.95%",
          "chgp_class": "negative"
        },
        {
          "field": "Operating Profit Margin (Excl OI)",
          "val1": "5.09%",
          "val2": "5.86%",
          "chgp": "-0.77%",
          "chgp_class": "negative"
        }
      ]
    }
  }
]

Quarterly Results Snapshot (Consolidated) - Jun'26 - QoQstock-summary

Jun'26
Mar'26
Change(%)
Net Sales
2,091.89
1,770.69
18.14%
Operating Profit (PBDIT) excl Other Income
93.03
78.36
18.72%
Interest
23.49
23.04
1.95%
Exceptional Items
-0.20
-1.54
87.01%
Consolidate Net Profit
71.90
38.66
85.98%
Operating Profit Margin (Excl OI)
4.45%
4.43%
0.02%
Values in Rs Cr.
Direction Arrows
Net Sales

QoQ Growth in quarter ended Jun 2026 is 18.14% vs -17.48% in Mar 2026

Direction Arrows
Consolidated Net Profit

QoQ Growth in quarter ended Jun 2026 is 85.98% vs -7.29% in Mar 2026

Half Yearly Results Snapshot (Consolidated) - Sep'25stock-summary

Sep'25
Sep'24
Change(%)
Net Sales
4,481.80
4,109.70
9.05%
Operating Profit (PBDIT) excl Other Income
234.72
260.61
-9.93%
Interest
47.52
45.12
5.32%
Exceptional Items
25.65
0.00
Consolidate Net Profit
138.49
140.18
-1.21%
Operating Profit Margin (Excl OI)
5.24%
6.34%
-1.10%
Values in Rs Cr.
Direction Arrows
Net Sales

Growth in half year ended Sep 2025 is 9.05% vs 9.81% in Sep 2024

Direction Arrows
Consolidated Net Profit

Growth in half year ended Sep 2025 is -1.21% vs 16.84% in Sep 2024

Nine Monthly Results Snapshot (Consolidated) - Dec'25stock-summary

Dec'25
Dec'24
Change(%)
Net Sales
6,627.48
6,170.71
7.40%
Operating Profit (PBDIT) excl Other Income
349.19
376.36
-7.22%
Interest
71.73
71.07
0.93%
Exceptional Items
-4.45
-3.71
-19.95%
Consolidate Net Profit
180.19
189.76
-5.04%
Operating Profit Margin (Excl OI)
5.27%
6.10%
-0.83%
Values in Rs Cr.
Direction Arrows
Net Sales

YoY Growth in nine months ended Dec 2025 is 7.40% vs 9.50% in Dec 2024

Direction Arrows
Consolidated Net Profit

YoY Growth in nine months ended Dec 2025 is -5.04% vs -6.23% in Dec 2024

Annual Results Snapshot (Consolidated) - Mar'26stock-summary

Mar'26
Mar'25
Change(%)
Net Sales
8,398.17
8,139.57
3.18%
Operating Profit (PBDIT) excl Other Income
427.55
476.70
-10.31%
Interest
94.77
94.60
0.18%
Exceptional Items
-5.99
-6.82
12.17%
Consolidate Net Profit
218.85
254.33
-13.95%
Operating Profit Margin (Excl OI)
5.09%
5.86%
-0.77%
Values in Rs Cr.
Direction Arrows
Net Sales

YoY Growth in year ended Mar 2026 is 3.18% vs 11.51% in Mar 2025

Direction Arrows
Consolidated Net Profit

YoY Growth in year ended Mar 2026 is -13.95% vs -1.81% in Mar 2025

stock-summaryCompany CV
About Thomas Cook (India) Ltd stock-summary
stock-summary
Thomas Cook (India) Ltd
Small Cap
Tour, Travel Related Services
Thomas Cook (India) Limited was incorporated as 'Thomas Cook (India) Private Limited' on October 21, 1978. The name was changed to Thomas Cook (India) Limited on March 07, 1979. The Company was originally promoted by Thomas Cook Group Limited , the history of which can be traced back to the founder Thomas Cook. He commenced business in the United Kingdom in 1841 which included organizing group tours called Cook's Tours.
Company Coordinates stock-summary
Company Details
Thomas Cook Building, Dr Dadabhai Naoroji Road Fort Mumbai Maharashtra : 400001
stock-summary
Tel: 91-22-4242 7000
stock-summary
sharedept@in.thomascook.com
Registrar Details
TSR Darashaw Ltd, 6-10 , Haji Moosa Patrawala Indl. Est , 20 Dr.E.Moses Road , Mahalaxmi , Mumbai