
Compare Thomas Scott with Similar Stocks
Dashboard
Strong ability to service debt as the company has a low Debt to EBITDA ratio of 1.39 times
Healthy long term growth as Net Sales has grown by an annual rate of 64.02% and Operating profit at 99.17%
With a growth in Operating Profit of 37.44%, the company declared Very Positive results in Mar 26
With ROCE of 16.8, it has a Fair valuation with a 2.8 Enterprise value to Capital Employed
Majority shareholders : Promoters
Stock DNA
Garments & Apparels
INR 472 Cr (Micro Cap)
23.00
22
0.00%
0.34
14.71%
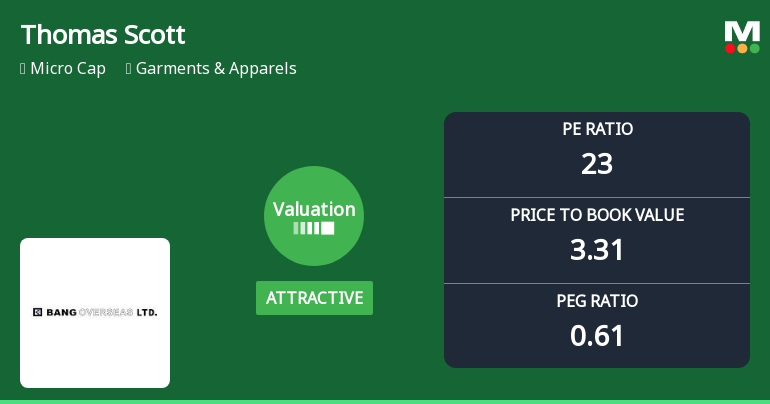
3.31
Total Returns (Price + Dividend) 
Thomas Scott for the last several years.
Risk Adjusted Returns v/s
Returns Beta

News
Thomas Scott India Ltd Valuation Shifts Signal Renewed Price Attractiveness
Thomas Scott India Ltd, a micro-cap player in the Garments & Apparels sector, has seen a notable shift in its valuation parameters, moving from a fair to an attractive rating. This change reflects evolving market perceptions amid mixed returns and peer comparisons, prompting a reassessment of its price attractiveness for investors.
Read full news article
Thomas Scott India Ltd is Rated Hold
Thomas Scott India Ltd is rated 'Hold' by MarketsMOJO, with this rating last updated on 06 July 2026. However, the analysis and financial metrics presented here reflect the company’s current position as of 18 July 2026, providing investors with the latest insights into its performance and outlook.
Read full news article
Thomas Scott India Ltd Downgraded to Hold Amid Mixed Technicals and Valuation Assessment
Thomas Scott India Ltd, a micro-cap player in the Garments & Apparels sector, has seen its investment rating downgraded from Buy to Hold as of 6 July 2026. This adjustment reflects a nuanced reassessment across four key parameters: quality, valuation, financial trend, and technicals. Despite robust financial performance and long-term growth, evolving technical indicators and valuation metrics have tempered investor enthusiasm.
Read full news article Announcements
Thomas Scott (India) Limited - Outcome of Board Meeting
15-Nov-2019 | Source : NSEThomas Scott (India) Limited has informed the Exchange regarding Board meeting held on November 14, 2019.
Shareholders meeting
05-Sep-2019 | Source : NSE
| Thomas Scott (India) Limited has informed the Exchange regarding Notice of Annual General Meeting to be held on September 30, 2019 |
Reply to Clarification- Financial results
22-Aug-2019 | Source : NSE
| The Exchange had sought clarification from Thomas Scott (India) Limited for the quarter ended 30-Jun-2019 with respect to Regulation 33 of the SEBI (Listing Obligations and Disclosure Requirements) Regulations, 2015. On basis of above the Company was required to clarify the following: -1. No Segment Reporting. The response of the Company is enclosed. |
Corporate Actions

No Upcoming Board Meetings

No Dividend history available

No Splits history available

No Bonus history available

No Rights history available
Quality key factors
Valuation key factors
Technicals key factors
 Technical Indicator Scale: Bearish, Mildly Bearish, Sideways, Mildly Bullish, Bullish Turned
 Shareholding Snapshot : Jun 2026
Shareholding Compare (%holding)
Promoters
None
Held by 0 Schemes
Held by 1 FIIs (0.04%)
Brijgopal Bang (22.54%)
Shankar Sharma (6.67%)
34.47%
Quarterly Results Snapshot (Standalone) - Mar'26 - QoQ

QoQ Growth in quarter ended Mar 2026 is 17.45% vs 16.37% in Dec 2025
QoQ Growth in quarter ended Mar 2026 is 21.13% vs 5.30% in Dec 2025
Half Yearly Results Snapshot (Standalone) - Sep'25
Growth in half year ended Sep 2025 is 62.95% vs 61.74% in Sep 2024
Growth in half year ended Sep 2025 is 93.84% vs 16.25% in Sep 2024
Nine Monthly Results Snapshot (Standalone) - Dec'25

YoY Growth in nine months ended Dec 2025 is 56.13% vs 78.04% in Dec 2024
YoY Growth in nine months ended Dec 2025 is 82.13% vs 19.73% in Dec 2024
Annual Results Snapshot (Standalone) - Mar'26
YoY Growth in year ended Mar 2026 is 58.29% vs 76.78% in Mar 2025
YoY Growth in year ended Mar 2026 is 50.78% vs 27.74% in Mar 2025
About Thomas Scott India Ltd

Company Coordinates


