
Compare Thomas Scott with Similar Stocks
Dashboard
Strong ability to service debt as the company has a low Debt to EBITDA ratio of 1.39 times
Healthy long term growth as Net Sales has grown by an annual rate of 64.02% and Operating profit at 99.17%
With a growth in Operating Profit of 37.44%, the company declared Very Positive results in Mar 26
With ROCE of 16.8, it has a Very Attractive valuation with a 2.3 Enterprise value to Capital Employed
Majority shareholders : Promoters
Underperformed the market in the last 1 year
Stock DNA
Garments & Apparels
INR 379 Cr (Micro Cap)
18.00
21
0.00%
0.34
14.71%
2.68
Total Returns (Price + Dividend) 
Thomas Scott for the last several years.
Risk Adjusted Returns v/s
Returns Beta

News
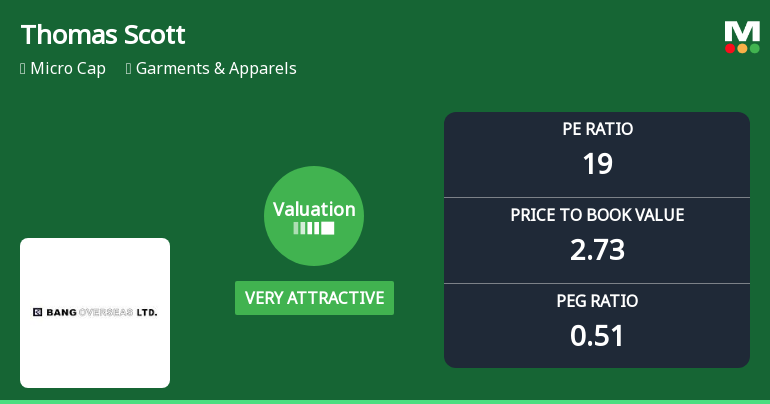
Thomas Scott India Ltd Valuation Shifts to Very Attractive Amid Market Challenges
Thomas Scott India Ltd, a micro-cap player in the Garments & Apparels sector, has seen a notable shift in its valuation parameters, moving from an attractive to a very attractive grade. Despite recent price declines and underperformance relative to the Sensex, the company’s improved price-to-earnings and price-to-book ratios suggest a compelling entry point for investors willing to look beyond short-term volatility.
Read full news article
Thomas Scott India Ltd is Rated Hold
Thomas Scott India Ltd is rated 'Hold' by MarketsMOJO, with this rating last updated on 09 February 2026. However, the analysis and financial metrics discussed here reflect the stock's current position as of 10 June 2026, providing investors with an up-to-date view of the company’s fundamentals, returns, and market standing.
Read full news articleAre Thomas Scott India Ltd latest results good or bad?
Thomas Scott India Ltd's latest financial results for Q4 FY26 reveal a strong operational performance, characterized by notable growth in both revenue and net profit. The company reported a net profit of ₹6.02 crores, reflecting a significant year-on-year increase of 44.71%. Revenue for the quarter reached ₹77.81 crores, marking a robust year-on-year growth of 63.40%. This performance is particularly impressive given the broader garments and apparels sector's decline of 13.86% during the same period. The operating margin improved to 14.16%, a substantial increase from the previous quarter, indicating effective cost management and operational leverage as the company scales its operations. Additionally, the return on equity (ROE) of 19.70% is well above the peer average, showcasing the company's ability to generate strong returns on shareholder capital. Despite these positive operational metrics, the compan...
Read full news article Announcements
Announcement under Regulation 30 (LODR)-Earnings Call Transcript
06-Jun-2026 | Source : BSEenclosed herewith transcript of earning call held on June 3 2026
Announcement under Regulation 30 (LODR)-Investor Presentation
03-Jun-2026 | Source : BSEEnclosed herewith Investor Presentation for the Quarter and Financial year ended 31st March 2026.
Announcement under Regulation 30 (LODR)-Analyst / Investor Meet - Outcome
03-Jun-2026 | Source : BSEEnclosed herewith Earning Call audio link for Q4 & FY 2025-26.
Corporate Actions

No Upcoming Board Meetings

No Dividend history available

No Splits history available

No Bonus history available

No Rights history available
Quality key factors
Valuation key factors
Technicals key factors
 Technical Indicator Scale: Bearish, Mildly Bearish, Sideways, Mildly Bullish, Bullish Turned
 Shareholding Snapshot : Mar 2026
Shareholding Compare (%holding)
Promoters
None
Held by 0 Schemes
Held by 1 FIIs (0.05%)
Brijgopal Bang (22.54%)
Shankar Sharma (8.12%)
33.15%
Quarterly Results Snapshot (Standalone) - Mar'26 - QoQ

QoQ Growth in quarter ended Mar 2026 is 17.45% vs 16.37% in Dec 2025
QoQ Growth in quarter ended Mar 2026 is 21.13% vs 5.30% in Dec 2025
Half Yearly Results Snapshot (Standalone) - Sep'25
Growth in half year ended Sep 2025 is 62.95% vs 61.74% in Sep 2024
Growth in half year ended Sep 2025 is 93.84% vs 16.25% in Sep 2024
Nine Monthly Results Snapshot (Standalone) - Dec'25

YoY Growth in nine months ended Dec 2025 is 56.13% vs 78.04% in Dec 2024
YoY Growth in nine months ended Dec 2025 is 82.13% vs 19.73% in Dec 2024
Annual Results Snapshot (Standalone) - Mar'26
YoY Growth in year ended Mar 2026 is 58.29% vs 76.78% in Mar 2025
YoY Growth in year ended Mar 2026 is 50.78% vs 27.74% in Mar 2025
About Thomas Scott India Ltd

Company Coordinates


