
Compare Timken India with Similar Stocks
Stock DNA
Industrial Products
INR 27,556 Cr (Small Cap)
56.00
51
0.91%
-0.09
13.40%
9.07
Total Returns (Price + Dividend) 
Latest dividend: 36 per share ex-dividend date: Jul-25-2025
Risk Adjusted Returns v/s
Returns Beta

News

Timken India Ltd is Rated Hold by MarketsMOJO
Timken India Ltd is rated 'Hold' by MarketsMOJO, with this rating last updated on 20 May 2026. However, the analysis and financial metrics discussed here reflect the stock's current position as of 19 June 2026, providing investors with the latest insights into its performance and outlook.
Read full news article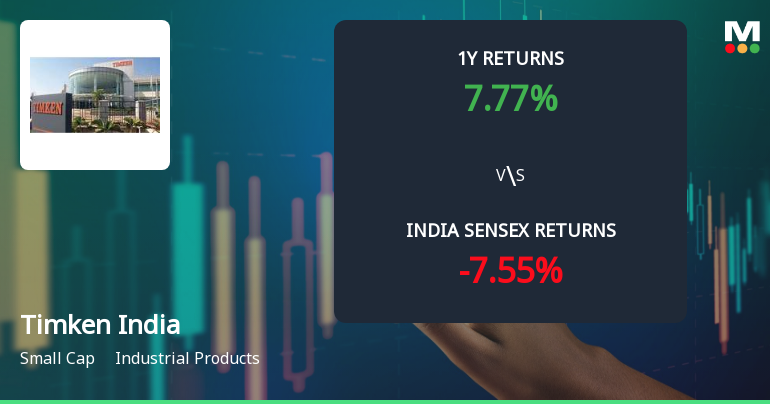
Timken India Ltd Technical Momentum Shifts to Bullish Amid Mixed Market Returns
Timken India Ltd has experienced a notable shift in its technical momentum, moving from a mildly bullish stance to a more confident bullish trend. This transition is underscored by positive signals from key technical indicators such as the MACD and moving averages, despite some mixed readings from other metrics. The stock’s recent price action and technical parameters suggest a strengthening momentum that investors should carefully analyse in the context of broader market performance and sector dynamics.
Read full news article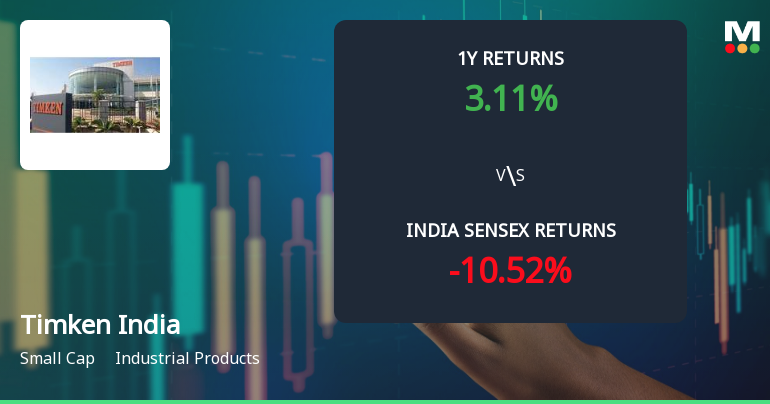
Timken India Ltd Technical Momentum Shifts to Mildly Bullish Amid Mixed Signals
Timken India Ltd has experienced a nuanced shift in its technical momentum, moving from a bullish to a mildly bullish stance as of June 2026. While key indicators such as MACD and KST maintain bullish signals on weekly and monthly charts, other metrics like the Dow Theory and RSI present a more cautious outlook. This mixed technical landscape, combined with the company’s recent downgrade from a Buy to a Hold rating, offers investors a complex picture amid broader market volatility.
Read full news article Announcements
Timken India Limited - Analysts/Institutional Investor Meet/Con. Call Updates
26-Nov-2019 | Source : NSETimken India Limited has informed the Exchange regarding Analysts/Institutional Investor Meet/Con. Call Updates
Timken India Limited - Other General Purpose
13-Nov-2019 | Source : NSETimken India Limited has informed the Exchange regarding Disclosure of related party transactions for the half year ended September 30, 2019.
Timken India Limited - Outcome of Board Meeting
25-Oct-2019 | Source : NSETimken India Limited has informed the Exchange regarding Outcome of Board Meeting held on October 25, 2019.
Corporate Actions

No Upcoming Board Meetings

Timken India Ltd has declared 360% dividend, ex-date: 25 Jul 25

No Splits history available

No Bonus history available

No Rights history available
Quality key factors
Valuation key factors
Technicals key factors
 Technical Indicator Scale: Bearish, Mildly Bearish, Sideways, Mildly Bullish, Bullish Turned
 Shareholding Snapshot : Mar 2026
Shareholding Compare (%holding)
Promoters
None
Held by 28 Schemes (25.88%)
Held by 127 FIIs (6.96%)
Timken Singapore Pte Ltd (51.05%)
Hdfc Mutual Fund - Hdfc Mid-cap Fund (7.94%)
8.41%
Quarterly Results Snapshot (Standalone) - Mar'26 - QoQ

QoQ Growth in quarter ended Mar 2026 is 40.39% vs -1.11% in Dec 2025
QoQ Growth in quarter ended Mar 2026 is 210.51% vs -44.28% in Dec 2025
Half Yearly Results Snapshot (Standalone) - Sep'25

Growth in half year ended Sep 2025 is 2.94% vs 9.79% in Sep 2024
Growth in half year ended Sep 2025 is 3.99% vs 1.68% in Sep 2024
Nine Monthly Results Snapshot (Standalone) - Dec'25
YoY Growth in nine months ended Dec 2025 is 6.26% vs 9.75% in Dec 2024
YoY Growth in nine months ended Dec 2025 is -6.53% vs 3.93% in Dec 2024
Annual Results Snapshot (Standalone) - Mar'26
YoY Growth in year ended Mar 2026 is 8.63% vs 8.19% in Mar 2025
YoY Growth in year ended Mar 2026 is -10.97% vs 14.09% in Mar 2025
About Timken India Ltd

Company Coordinates


