
Compare Tinna Rubber with Similar Stocks
Dashboard
High Management Efficiency with a high ROCE of 21.28%
Healthy long term growth as Net Sales has grown by an annual rate of 33.29% and Operating profit at 54.93%
Positive results in Mar 26
With ROCE of 19.1, it has a Expensive valuation with a 4.2 Enterprise value to Capital Employed
Majority shareholders : Promoters
Market Beating performance in long term as well as near term
Stock DNA
Industrial Products
INR 1,707 Cr (Micro Cap)
32.00
73
0.43%
0.42
17.59%
5.59
Total Returns (Price + Dividend) 
Latest dividend: 4 per share ex-dividend date: Sep-04-2025
Risk Adjusted Returns v/s
Returns Beta

News

Tinna Rubber & Infrastructure Ltd Sees Technical Momentum Shift Amid Strong Returns
Tinna Rubber & Infrastructure Ltd has experienced a notable shift in its technical momentum, moving from a mildly bearish stance to a mildly bullish outlook. This change is underscored by a mix of bullish and bearish signals across key technical indicators, reflecting a nuanced market sentiment for the industrial products micro-cap stock.
Read full news article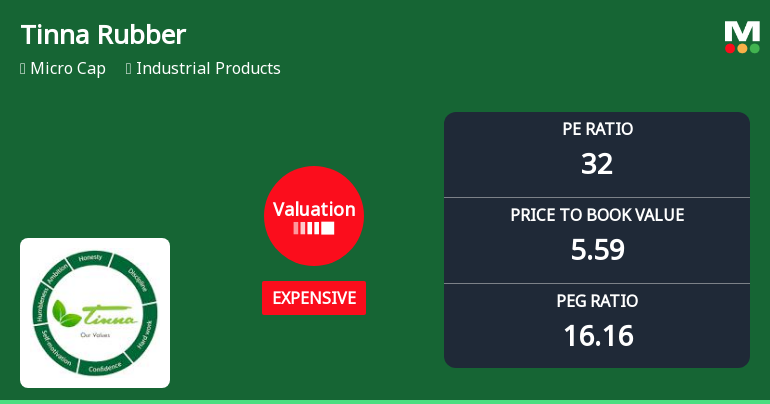
Tinna Rubber & Infrastructure Ltd: Valuation Shift Signals Price Attractiveness Change
Tinna Rubber & Infrastructure Ltd has witnessed a notable shift in its valuation parameters, moving from fair to expensive territory, despite delivering robust returns that have significantly outpaced the Sensex over multiple time horizons. This valuation recalibration invites a closer examination of the company’s price attractiveness relative to its historical averages and peer group within the industrial products sector.
Read full news article
Tinna Rubber & Infrastructure Ltd: Technical Momentum Shifts Amid Mixed Indicator Signals
Tinna Rubber & Infrastructure Ltd has experienced a notable shift in its technical momentum, moving from a sideways trend to a mildly bearish stance. Despite this, several key indicators present a mixed picture, with weekly signals showing bullish tendencies while monthly metrics suggest caution. This nuanced technical landscape warrants a detailed analysis for investors navigating the micro-cap industrial products sector.
Read full news article Announcements
Pursuant To Regulation 30(4)(I)(D) Of SEBI (LODR) Regulations 2015
22-Jun-2026 | Source : BSETinna Rubber And Infrastructure Limited is proud to announce the inaugral dispatch from our state of art rCB and TPO facility at Varale Maharahtra as per letter enclosed.
Announcement under Regulation 30 (LODR)-Analyst / Investor Meet - Intimation
04-Jun-2026 | Source : BSETinna Rubber and Infrastructure Limited has informed to Stock Exchange about the Investor meet to be held on Friday June 05 2026.
Announcement under Regulation 30 (LODR)-Earnings Call Transcript
28-May-2026 | Source : BSEThe Earnings Call Transcript of the earnings conference call held on Monday May 25 2026 for the fourth quarter and financial year ended on 31 March 2026.
Corporate Actions

No Upcoming Board Meetings

Tinna Rubber & Infrastructure Ltd has declared 40% dividend, ex-date: 04 Sep 25

No Splits history available

Tinna Rubber & Infrastructure Ltd has announced 1:1 bonus issue, ex-date: 15 Sep 23

No Rights history available
Quality key factors
Valuation key factors
Technicals key factors
 Technical Indicator Scale: Bearish, Mildly Bearish, Sideways, Mildly Bullish, Bullish Turned
 Shareholding Snapshot : Mar 2026
Shareholding Compare (%holding)
Promoters
None
Held by 3 Schemes (5.35%)
Held by 2 FIIs (0.36%)
Bhupinder Kumar Sekhri (50.07%)
Bank Of India (1.94%)
19.67%
Quarterly Results Snapshot (Consolidated) - Mar'26 - YoY

YoY Growth in quarter ended Mar 2026 is 21.64% vs 17.46% in Mar 2025
YoY Growth in quarter ended Mar 2026 is 41.52% vs -25.42% in Mar 2025
Half Yearly Results Snapshot (Consolidated) - Sep'25

Growth in half year ended Sep 2025 is -1.51% vs 58.36% in Sep 2024
Growth in half year ended Sep 2025 is -17.57% vs 94.41% in Sep 2024
Nine Monthly Results Snapshot (Consolidated) - Dec'25
YoY Growth in nine months ended Dec 2025 is 3.33% vs 48.63% in Dec 2024
YoY Growth in nine months ended Dec 2025 is -0.98% vs 48.92% in Dec 2024
Annual Results Snapshot (Consolidated) - Mar'26
YoY Growth in year ended Mar 2026 is 8.01% vs 39.20% in Mar 2025
YoY Growth in year ended Mar 2026 is 9.28% vs 20.03% in Mar 2025
About Tinna Rubber & Infrastructure Ltd

Company Coordinates


